我正在尝试使用 Python 和 Matplotlib 可视化 3D 数据集,该数据集由 x-z 数据的时间序列(沿 y)组成。
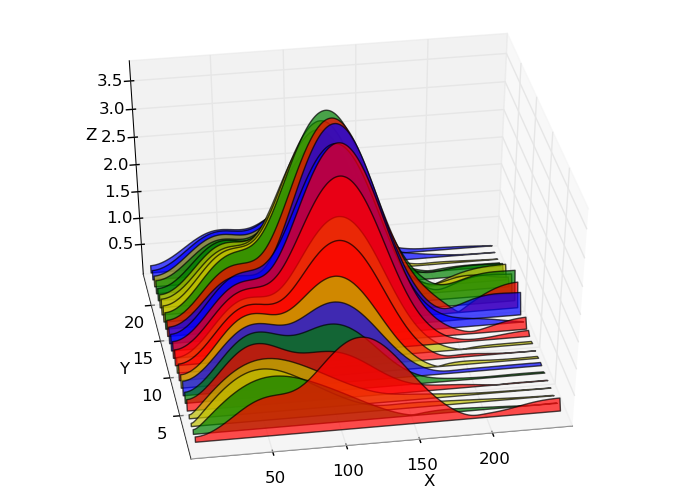
我想创建一个如下图所示的图(用 Python 制作:http://austringer.net/wp/index.php/2011/05/20/plotting-a-dolphin-biosonar-click-train/),但颜色随 Z 变化 - 即强度由颜色图和峰高显示,为清楚起见。
在 Z 中显示颜色图的示例是(显然是使用 MATLAB 制作的):
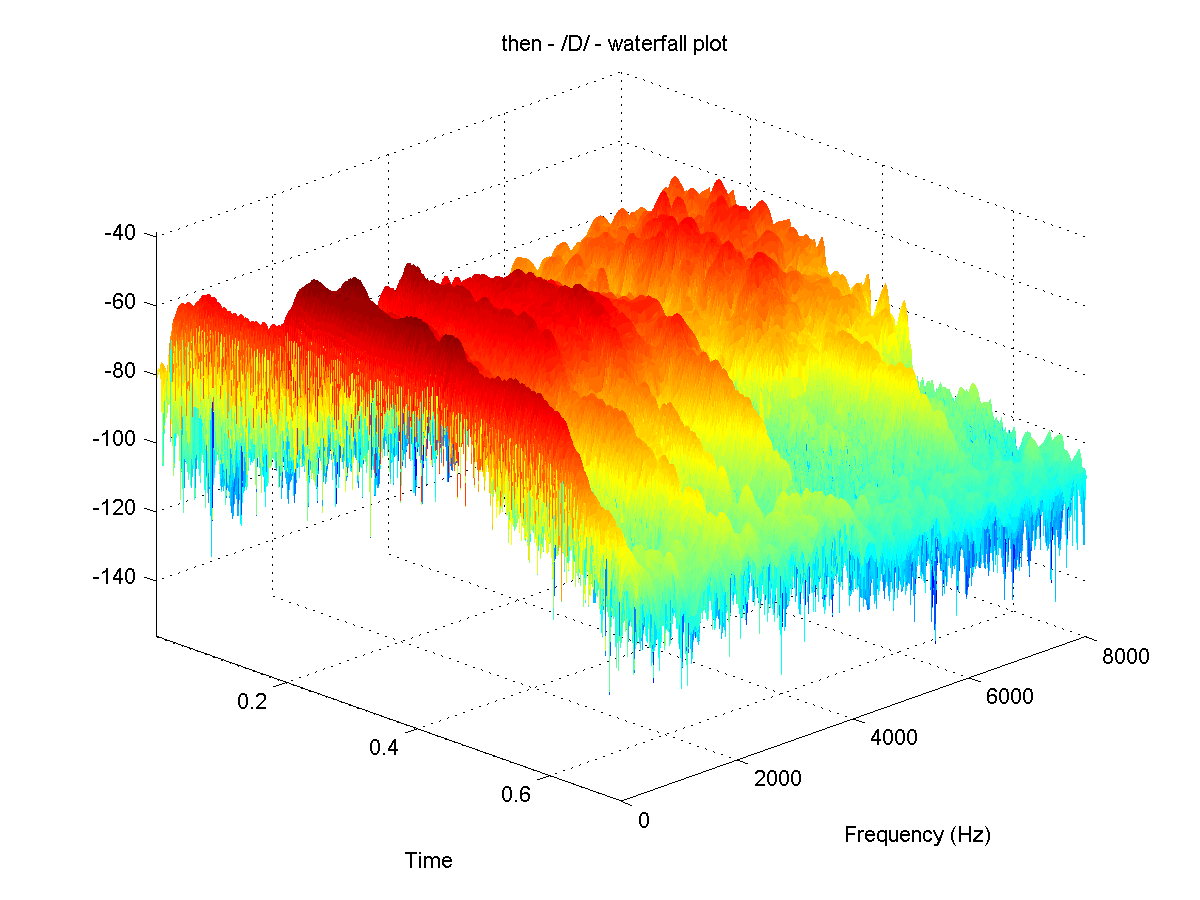
可以使用 MATLAB 中的瀑布图选项创建此效果,但我知道在 Python 中没有直接等效的方法。
我也尝试过在 Python 中使用 plot_surface 选项(如下),它工作正常,但我想“强制”在表面上运行的线只在 x 方向(即让它看起来更像一个堆叠的时间序列而不是一个表面)。这可能吗?

非常欢迎任何帮助或建议。谢谢。
最佳答案
我已经生成了一个在 matplotlib 中复制 matlab 瀑布行为的函数,但我不认为它是性能方面的最佳解决方案。
我从 matplotlib 文档中的两个示例开始:multicolor lines和 multiple lines in 3d plot .从这些示例中,我只看到可以根据示例后的 z 值绘制颜色随给定颜色图变化的线条,该示例 reshape 输入数组以按 2 点的线段绘制线并将线段的颜色设置为2 点之间的 z 平均值。
因此,给定输入矩阵 n,m 矩阵 X、Y 和 Z,函数循环在 n,m 之间的最小维度上绘制每条线,如示例中所示,按 2 点段绘制,其中按段绘制的 reshape 是使用与示例相同的代码 reshape 数组。
def waterfall_plot(fig,ax,X,Y,Z):
    '''
    Make a waterfall plot
    Input:
        fig,ax : matplotlib figure and axes to populate
        Z : n,m numpy array. Must be a 2d array even if only one line should be plotted
        X,Y : n,m array
    '''
    # Set normalization to the same values for all plots
    norm = plt.Normalize(Z.min().min(), Z.max().max())
    # Check sizes to loop always over the smallest dimension
    n,m = Z.shape
    if n>m:
        X=X.T; Y=Y.T; Z=Z.T
        m,n = n,m

    for j in range(n):
        # reshape the X,Z into pairs
        points = np.array([X[j,:], Z[j,:]]).T.reshape(-1, 1, 2)
        segments = np.concatenate([points[:-1], points[1:]], axis=1)
        lc = LineCollection(segments, cmap='plasma', norm=norm)
        # Set the values used for colormapping
        lc.set_array((Z[j,1:]+Z[j,:-1])/2)
        lc.set_linewidth(2) # set linewidth a little larger to see properly the colormap variation
        line = ax.add_collection3d(lc,zs=(Y[j,1:]+Y[j,:-1])/2, zdir='y') # add line to axes

    fig.colorbar(lc) # add colorbar, as the normalization is the same for all, it doesent matter which of the lc objects we use
因此,可以使用与 matplotlib 曲面图相同的输入矩阵轻松生成看起来像 matlab 瀑布的图:
import numpy as np; import matplotlib.pyplot as plt
from matplotlib.collections import LineCollection
from mpl_toolkits.mplot3d import Axes3D

# Generate data
x = np.linspace(-2,2, 500)
y = np.linspace(-2,2, 40)
X,Y = np.meshgrid(x,y)
Z = np.sin(X**2+Y**2)
# Generate waterfall plot
fig = plt.figure()
ax = fig.add_subplot(111, projection='3d')
waterfall_plot(fig,ax,X,Y,Z)
ax.set_xlabel('X') ; ax.set_xlim3d(-2,2)
ax.set_ylabel('Y') ; ax.set_ylim3d(-2,2)
ax.set_zlabel('Z') ; ax.set_zlim3d(-1,1)
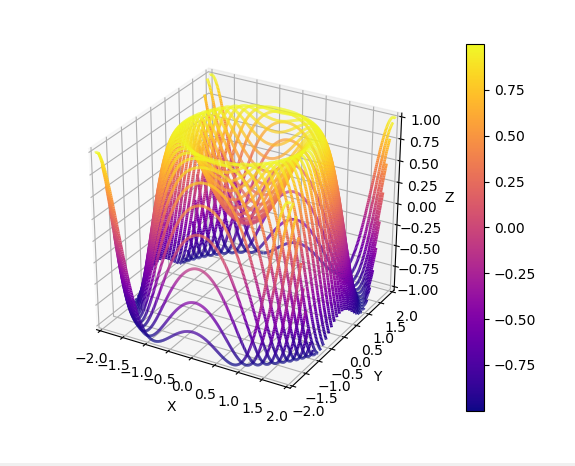
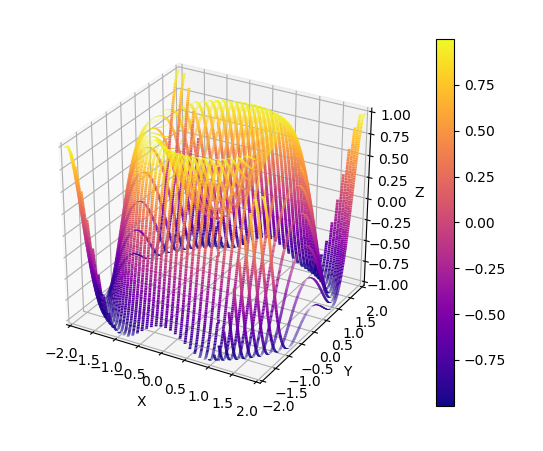
该函数假定在生成网格时,x 数组是最长的,并且默认情况下线的 y 是固定的,而 x 坐标是变化的。但是,如果 y 维度的大小较大,则矩阵被转置,生成具有固定 x 的行。因此,生成尺寸反转的网格(len(x)=40 和 len(y)=500)会产生:
关于python - 具有彩色高度的 Matplotlib 3D 瀑布图,我们在Stack Overflow上找到一个类似的问题: https://stackoverflow.com/questions/46366461/