以下循环的每次迭代都会生成一个维度为 50x1 的向量 我想将循环中的所有向量集中存储在一个数据结构中。
  def get_y_hat(y_bar, x_train, theta_Ridge_Matrix):
     print theta_Ridge_Matrix.shape
     print theta_Ridge_Matrix.shape[0]
     for i in range(theta_Ridge_Matrix.shape[0]):
        yH = np.dot(x_train, theta_Ridge_Matrix[i].T)
        print yH
我应该使用哪种数据结构?我是 Python 新手,但根据我在网上研究的内容,有 2 个选项:numpy 数组和列表列表
稍后我需要在此方法之外访问每个包含 50 个元素的向量。我将存储 200 到 500 个向量。
有人能给我这种数据结构的示例代码吗
谢谢
最佳答案
我认为将循环中的数据存储在 dict 中,然后将其转换为 pandas.Dataframe (构建在 numpy 数组之上)应该是一个有效的解决方案,允许您将数据作为整体或单个向量进一步处理。
举个例子:
import pandas as pd
import numpy as np

data = {}
# this would be your loop
for i in range(50):
    data['run_%02d' % i] = np.random.randn(50)
data = pd.DataFrame(data) # sorted keys of the dict will be the columns
您可以将单个向量作为属性或通过键访问:
print data['run_42'].describe() # or data.run_42.describe()

count    50.000000
mean      0.021426
std       1.027607
min      -2.472225
25%      -0.601868
50%       0.014949
75%       0.641488
max       2.391289
或进一步分析整个数据:
print data.mean()

run_00   -0.015224
run_01   -0.006971
..
run_48   -0.115935
run_49    0.147738
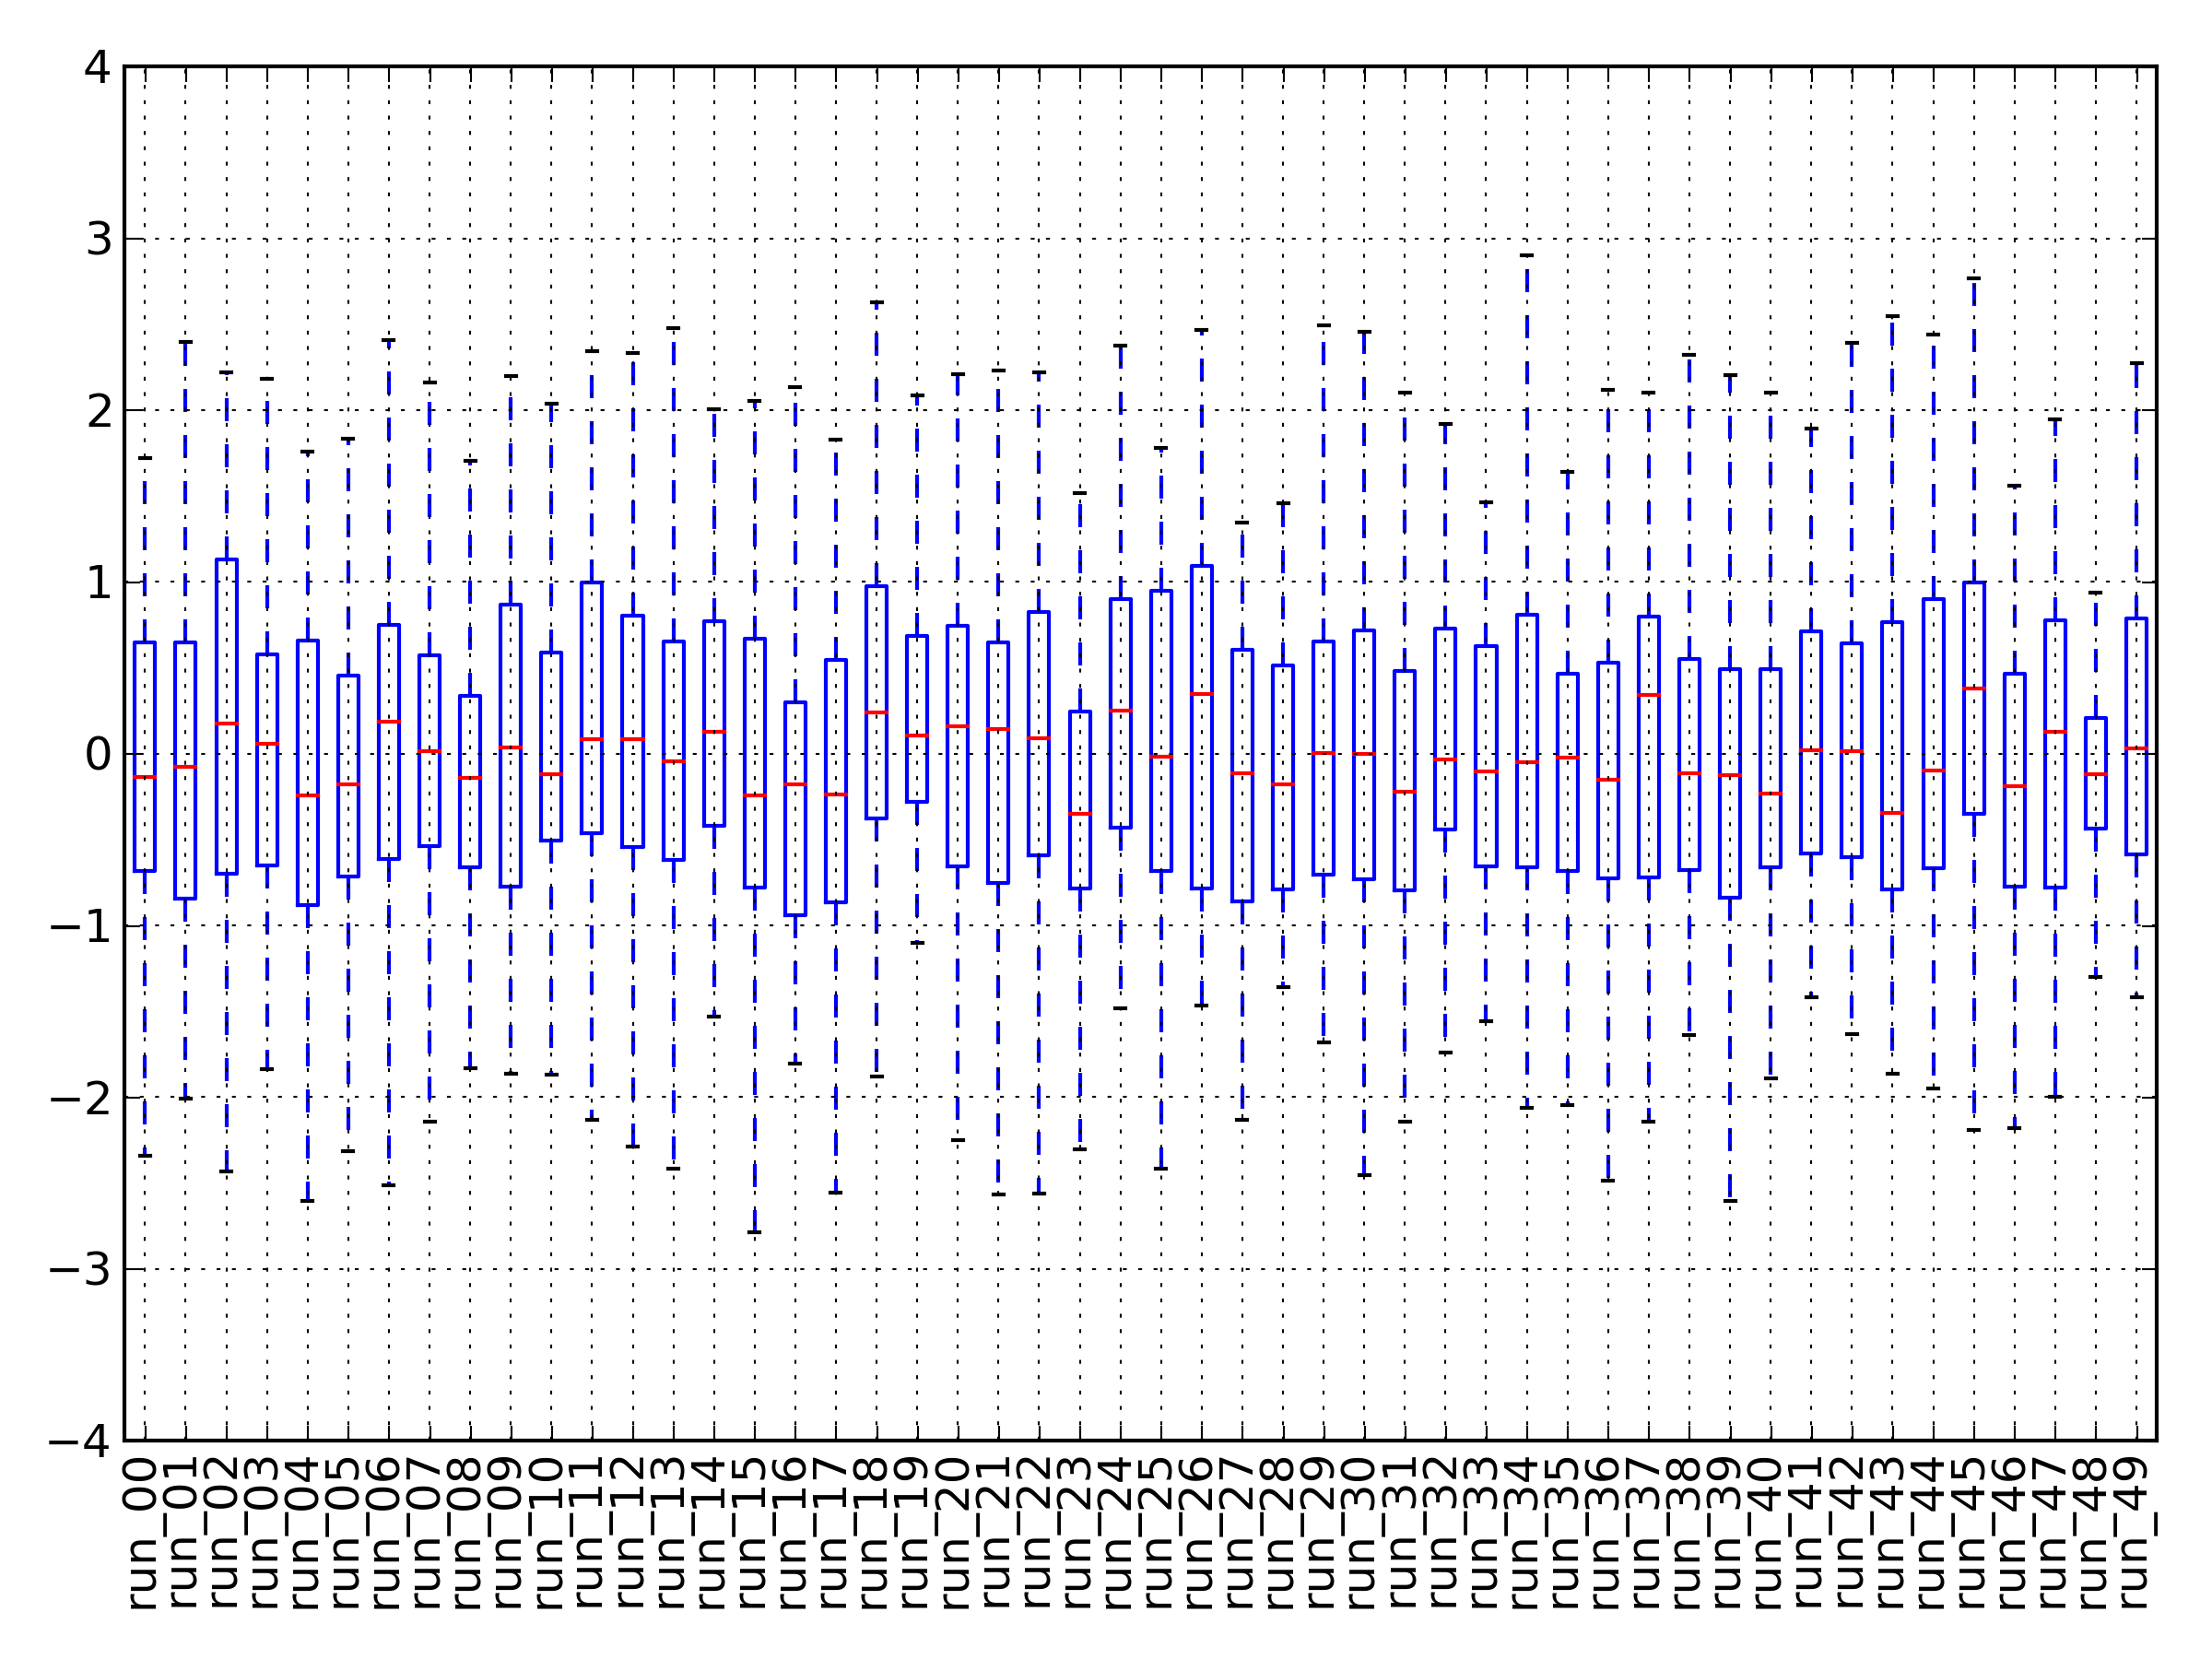
或者使用matplotlib查看您的数据(因为您使用matplotlib标记您的问题):
data.boxplot(rot=90)
plt.tight_layout()
关于python - 存储这些向量但在 Python 中使用哪种数据结构,我们在Stack Overflow上找到一个类似的问题: https://stackoverflow.com/questions/13437934/