我正在尝试构建一个程序,在给定图表上一堆点的坐标的情况下,找到(粗略地)图表的方程。假设给定的坐标代表整个图(即:行为在给定域之外不会改变)。
我使用下面的简单函数来执行此操作:
#x and y are arrays of the x coordinates and corrosponding y coordinates
def get_equation(x,y):
    degree = 2
    coefs, res, _, _, _ = np.polyfit(x,y,degree, full = True)
    ffit = np.poly1d(coefs)
    print (ffit)
    return ffit
这对于基本方程图上的坐标(例如 x^2)来说相当有效,但对于更复杂的图(例如下图)根本不起作用。
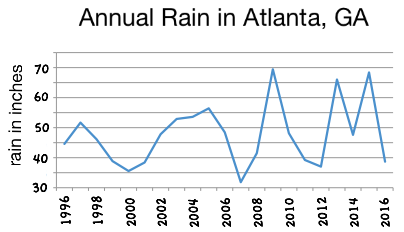
如何找到更复杂的图形(如上面给出的图形坐标)的方程?
此外,是否可以计算出图形的阶数,还是始终必须手动输入?
最佳答案
您需要更改多项式的次数。例如,我创建了一个五阶多项式。
import numpy as np
import matplotlib.pyplot as plt
def SomePoly(k):
    a = [9, 1.5, -12.5, -2.5, 3.5, 1]
    return sum([a[p]*k**p for p in range(len(a))])
x = np.arange(-3,2, 0.1)
y = SomePoly(x)
plt.plot(x, y)
现在查看每个学位的结果:
for degree in [2,4,5]:
    coefs, res, _, _, _ = np.polyfit(x,y,degree, full = True)
    print(degree, res)
结果:
2 [947.22023682]
4 [683.734662]
5 [8.70566837e-27]
关于Python-获取给定坐标的图方程,我们在Stack Overflow上找到一个类似的问题: https://stackoverflow.com/questions/53024952/