我想设计如下图,但是,我不知道如何添加图中所示的标记。 有人可以帮我解决这个问题吗?
为了绘制图表,我使用了 python 中的 matplotlib 包。

最佳答案
来自 matplotlib 文档 Annotations您可以使用代码修改示例
import numpy as np
import matplotlib.pyplot as plt
fig, ax = plt.subplots()
t = np.arange(0.0, 5.0, 0.01)
s = np.cos(2*np.pi*t)
line, = ax.plot(t, s, lw=2)
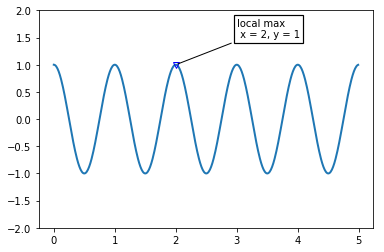
ax.plot(2, 1, marker = "v", color='blue', fillstyle='none')
bbox_props = dict(boxstyle="square,pad=0.3", fc="white", ec="black", lw=1.2)
t = ax.annotate('local max\n x = 2, y = 1', xy=(2, 1), xytext=(3, 1.5),
arrowprops=dict(arrowstyle="-", facecolor='black'), bbox=bbox_props,
)
ax.set_ylim(-2, 2)
plt.show()
关于python - 如何使用 python 在图形中添加标记,如下所示?,我们在Stack Overflow上找到一个类似的问题: https://stackoverflow.com/questions/55355862/