我正在尝试使用点阵中的条形图绘制绘图,但我在给定面板的未使用因子方面遇到一些问题。我尝试过使用 drop.unused.levels 但似乎它只会在未在任何面板中使用它们时删除因子。
这是我正在使用的数据框:
dm <- structure(list(Benchmark = structure(c(1L, 2L, 3L, 4L, 5L, 6L,
7L, 1L, 2L, 3L, 4L, 5L, 6L, 7L, 1L, 2L, 3L, 4L, 5L, 6L, 7L, 1L,
2L, 3L, 4L, 5L, 6L, 7L, 1L, 2L, 3L, 4L, 5L, 6L, 7L), class = "factor", .Label = c("416.gamess",
"429.mcf", "436.cactusADM", "458.sjeng", "462.libquantum", "471.omnetpp",
"482.sphinx3")), Class = structure(c(3L, 1L, 2L, 3L, 1L, 4L,
2L, 3L, 1L, 2L, 3L, 1L, 4L, 2L, 3L, 1L, 2L, 3L, 1L, 4L, 2L, 3L,
1L, 2L, 3L, 1L, 4L, 2L, 3L, 1L, 2L, 3L, 1L, 4L, 2L), class = "factor", .Label = c("CS",
"PF", "PI", "PU")), Config = structure(c(1L, 1L, 1L, 1L, 1L,
1L, 1L, 2L, 2L, 2L, 2L, 2L, 2L, 2L, 3L, 3L, 3L, 3L, 3L, 3L, 3L,
4L, 4L, 4L, 4L, 4L, 4L, 4L, 5L, 5L, 5L, 5L, 5L, 5L, 5L), .Label = c("Disabled",
"Shallowest", "Deepest", "StorePref", "StridedPref"), class = "factor"),
    Perf = c(1, 0.72, 0.8, 1, 0.32, 1.16, 0.79, 1, 0.98, 1, 1,
    0.72, 1, 0.99, 1, 0.98, 1, 1, 1.12, 0.97, 1, 1, 0.97, 1,
    1, 0.99, 0.97, 1, 1, 1.18, 1, 1, 0.99, 0.97, 1)), .Names = c("Benchmark",
"Class", "Config", "Perf"), row.names = c(NA, -35L), class = "data.frame")
首先我尝试使用条形图,如下所示:
barchart(Perf ~ Benchmark | Class, dm, groups=Config,
         scales=list(x=list(relation='free')), auto.key=list(columns=3))
这给了我以下情节:
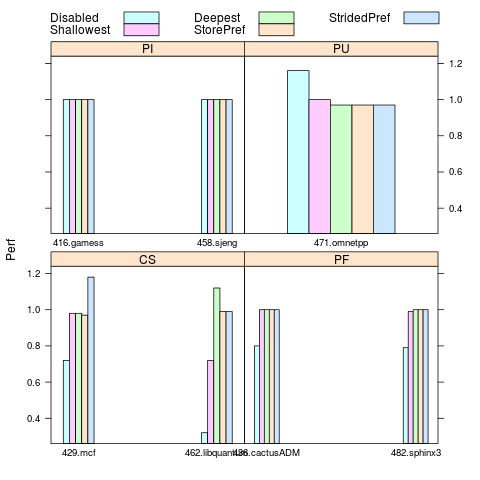
正如您所看到的,PI、PF 和 CS 类别的基准之间存在差距。原因是每个因素仅存在于给定类中,因此在所有其他类中都缺失,并且 条形图 可能会在 x 轴上引入间隙。
我的第二次尝试是调用 barchart 四次(每个类一次):
class.subset <- function(dframe, class.name) {
    return(dframe[dframe$Class == class.name, ])
}

pl1 <- barchart(Perf ~ Benchmark, class.subset(dm, 'PI'), groups=Config)
pl2 <- barchart(Perf ~ Benchmark, class.subset(dm, 'PF'),, groups=Config)
pl3 <- barchart(Perf ~ Benchmark, class.subset(dm, 'CS'),, groups=Config)
pl4 <- barchart(Perf ~ Benchmark, class.subset(dm, 'PU'),, groups=Config)

print(pl1, split=c(1, 1, 2, 2), more = TRUE)
print(pl2, split=c(1, 2, 2, 2), more = TRUE)
print(pl3, split=c(2, 1, 2, 2), more = TRUE)
print(pl4, split=c(2, 2, 2, 2))
我得到的图几乎是我想要的,但现在我不知道如何为所有子图创建单个全局图例(而不是为每个子图创建完全相同的图例):
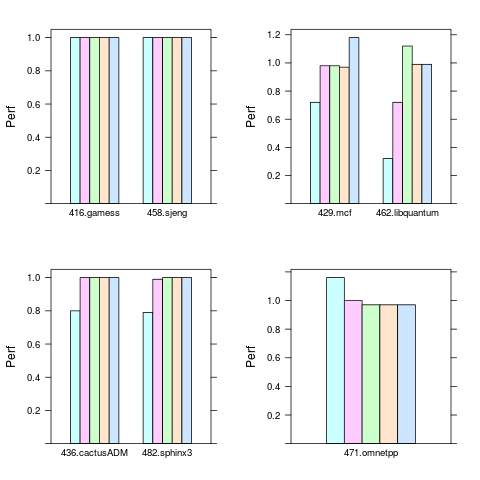
理想情况下,我更愿意使用第一种方法解决我面临的问题(因为这样我也会在每个面板中都有类名)。但是,如果在第二种情况下,可以为包含类名的每个子图添加全局图例和标题,那也可以。
最佳答案
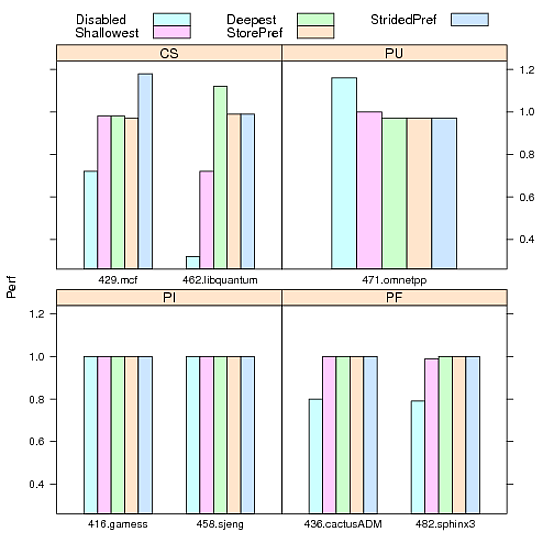
这是使用latticeExtra的快速方法:
pl1 <- barchart(Perf ~ Benchmark|Class, class.subset(dm, 'PI'), groups=Config,
                auto.key=list(columns=3))
pl2 <- barchart(Perf ~ Benchmark|Class, class.subset(dm, 'PF'), groups=Config)
pl3 <- barchart(Perf ~ Benchmark|Class, class.subset(dm, 'CS'), groups=Config)
pl4 <- barchart(Perf ~ Benchmark|Class, class.subset(dm, 'PU'), groups=Config)

library(latticeExtra)
pls <- c(pl1, pl2, pl3, pl4)
pls <- update(pls, scales=list(y="same"))
pls
关于删除条形图中每个面板未使用的因素,我们在Stack Overflow上找到一个类似的问题: https://stackoverflow.com/questions/12391429/