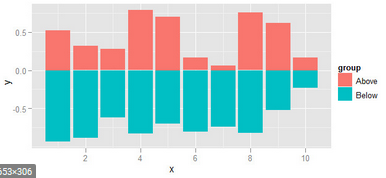
我想知道如何垂直镜像两种条形(正数和负数),如下图:
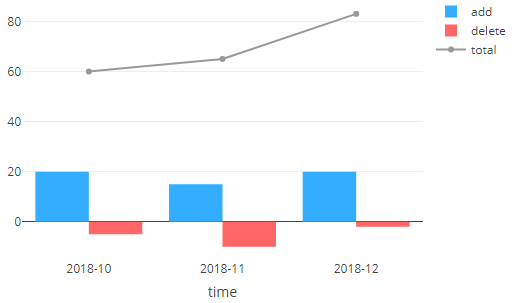
到目前为止,我只能让它们成为镜像,但并排站立,如下所示:
数据:
library(plotly)
time <- c("2018-10","2018-11","2018-12")
add <- c(20,15,20)
delete <- c(-5,-10,-2)
total <- c(60,65,83)
df <- data.frame(time,add,delete,total)

plot_ly(df) %>%
    add_trace(x = ~time, y = ~add, type = 'bar', name = 'add',
              marker = list(color = '#33adff'),
              hovertemplate = paste('add: %{y}',
                                    '<br>time: %{x}<br>')) %>%
    add_trace(x = ~time, y = ~delete, type = 'bar', name = 'delete',
              marker = list(color = '#ff6666'),
              hovertemplate = paste('delete: %{y}',
                                    '<br>time: %{x}<br>'))
最佳答案
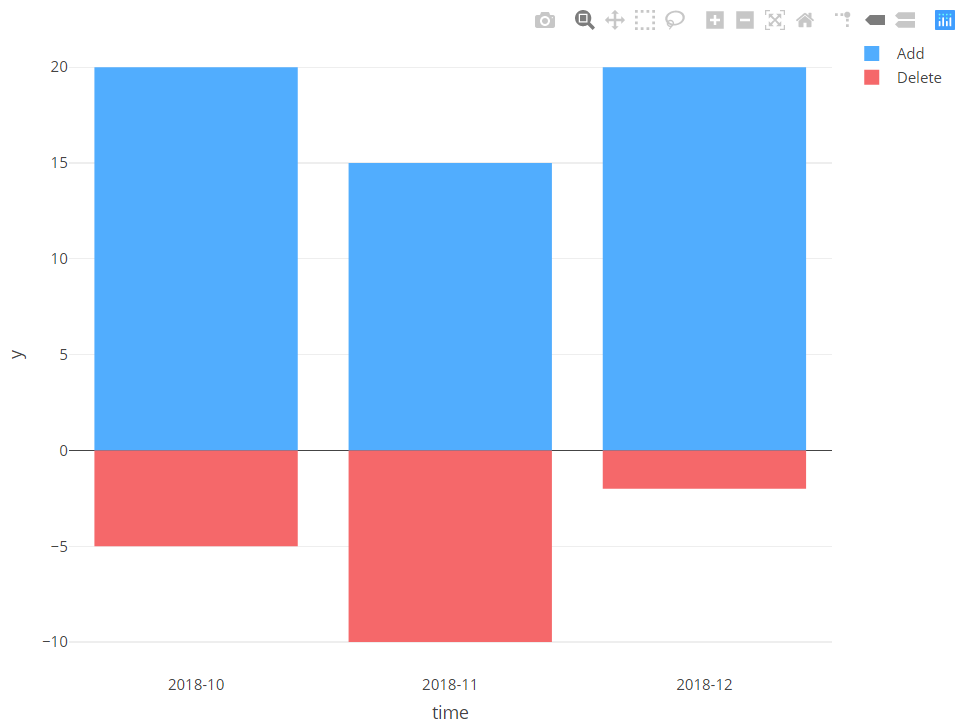
可以使用barmode="overlay"解决该问题。
您需要将df数据集设置为长数据格式。
library(plotly)
time <- c("2018-10","2018-11","2018-12")
add <- c(20,15,20)
delete <- c(-5,-10,-2)
total <- c(60,65,83)
n <- length(time)
df <- data.frame(time=rep(time,2), y=c(add, delete), grp=rep(c("Add","Delete"),each=n))

plot_ly(df) %>%
    add_trace(x = ~time, y = ~y, color=~grp, text=~grp, type = 'bar',
              marker = list(color = c(rep('#33adff',n), rep('#ff6666',n))),
              hovertemplate = paste('%{text}: %{y}', '<br>time: %{x}<br>')) %>%
    layout(barmode="overlay")
关于r - 用plotly绘制镜像条形图,我们在Stack Overflow上找到一个类似的问题: https://stackoverflow.com/questions/58074562/