我正在使用R中的包igraph来绘制网络。但是,当在 graph_from_data_frame 命令中传递 directed = TRUE 标志时,它在 R Studio 的绘图 Pane 中的显示方式完全正确。但是,一旦我预览为 PDF(导出、另存为 PDF、预览)或将绘图另存为 PDF,图形的所有顶点都是透明的。但是,设置 directed = FALSE 标志后,颜色将符合预期。
设置数据
stack.vtx <- data.frame(Dept = c("C-IIAC",  "EES-16",   "EES-17",   "A-1",  "ISR-1",    "ISR-2",    "ISR-6",    "NEN-5",    "AOT-AE",   "MPA-CINT", "MPA-MAGLAB",   "MPA-Q",    "MST-8",    "P-1",  "P-4",  "SIGMA-1",  "CCS-2",    "CCS-3",    "CCS-6",    "T-1",  "T-2",  "T-3",  "T-4",  "T-5",  "E-6",  "J-4",  "J-6",  "M-3",  "M-6",  "Q-5",  "AMPP-4",   "PT-DO",    "XCP-3",    "XCP-4",    "XCP-8",    "XTD-PRI"),
                        Count = c(2,    2,  1,  1,  1,  1,  1,  1,  1,  1,  1,  2,  2,  2,  1,  1,  2,  1,  2,  3,  4,  1,  1,  2,  1,  1,  1,  1,  1,  1,  1,  1,  1,  1,  1,  2),
                        Cols = c("#8B4513", "#8B4513",  "#8B4513",  "#FFB90F",  "#FFB90F",  "#FFB90F",  "#FFB90F",  "#FFB90F",  "#CDC8B1",  "#CDC8B1",  "#CDC8B1",  "#CDC8B1",  "#CDC8B1",  "#CDC8B1",  "#CDC8B1",  "#CDC8B1",  "#FF6347",  "#FF6347",  "#FF6347",  "#FF6347",  "#FF6347",  "#FF6347",  "#FF6347",  "#FF6347",  "#9AC0CD",  "#9AC0CD",  "#9AC0CD",  "#9AC0CD",  "#9AC0CD",  "#9AC0CD",  "#00CDCD",  "#00CDCD",  "#8A2BE2",  "#8A2BE2",  "#8A2BE2",  "#8A2BE2"))


stack.edges <- data.frame(from = c("AOT-AE",    "AOT-AE",   "C-IIAC",   "C-IIAC",   "CCS-2",    "EES-16",   "EES-16",   "EES-16",   "ISR-1",    "ISR-1",    "ISR-2",    "ISR-2",    "J-4",  "J-4",  "MPA-CINT", "MPA-CINT", "MPA-Q",    "MPA-Q",    "NEN-5",    "NEN-5",    "P-1",  "Q-5",  "T-1",  "T-1",  "T-2",  "T-2",  "T-2",  "T-2",  "XCP-4",    "XTD-PRI",  "XTD-PRI",  "XTD-PRI",  "XTD-PRI"),
                          to = c("CCS-3",   "J-6",  "AMPP-4",   "PT-DO",    "T-5",  "T-5",  "XCP-8",    "A-1",  "CCS-6",    "T-2",  "EES-17",   "EES-17",   "P-1",  "M-3",  "T-4",  "MPA-MAGLAB",   "CCS-6",    "C-IIAC",   "XCP-3",    "SIGMA-1",  "T-2",  "T-1",  "MST-8",    "MST-8",    "CCS-2",    "ISR-6",    "MPA-Q",    "MPA-Q",    "T-3",  "P-4",  "E-6",  "XTD-PRI",  "M-6"),
                          Cols = c("#66666660", "#66666660",    "#F0027F",  "#F0027F",  "#BEAED4",  "#7FC97F",  "#7FC97F",  "#7FC97F",  "#7FC97F",  "#7FC97F",  "#386CB0",  "#386CB0",  "#F0027F",  "#F0027F",  "#FDC086",  "#FDC086",  "#386CB0",  "#386CB0",  "#66666660",    "#66666660",    "#66666660",    "#FDC086",  "#7FC97F",  "#BEAED4",  "#66666660",    "#66666660",    "#66666660",    "#66666660",    "#BEAED4",  "#F0027F",  "#F0027F",  "#66666660",    "#66666660"))
绘制网络图
library(igraph)
stack_graph <- graph_from_data_frame(stack.edges, vertices = stack.vtx, directed = TRUE)

plot(stack_graph,
     layout = layout_in_circle(stack_graph),
     vertex.color = V(stack_graph)$Cols,
     vertex.shape = "sphere",
     vertex.label.color = "black",
     vertex.size = V(stack_graph)$Count * 4,
     vertex.label = "",
     edge.size = 0.3,
     edge.color = E(stack_graph)$Cols,
     edge.curved = 0.2,
     edge.arrow.size = 0) #Changing this flag with anything > 0 will cause transparency issues of the graph vertices
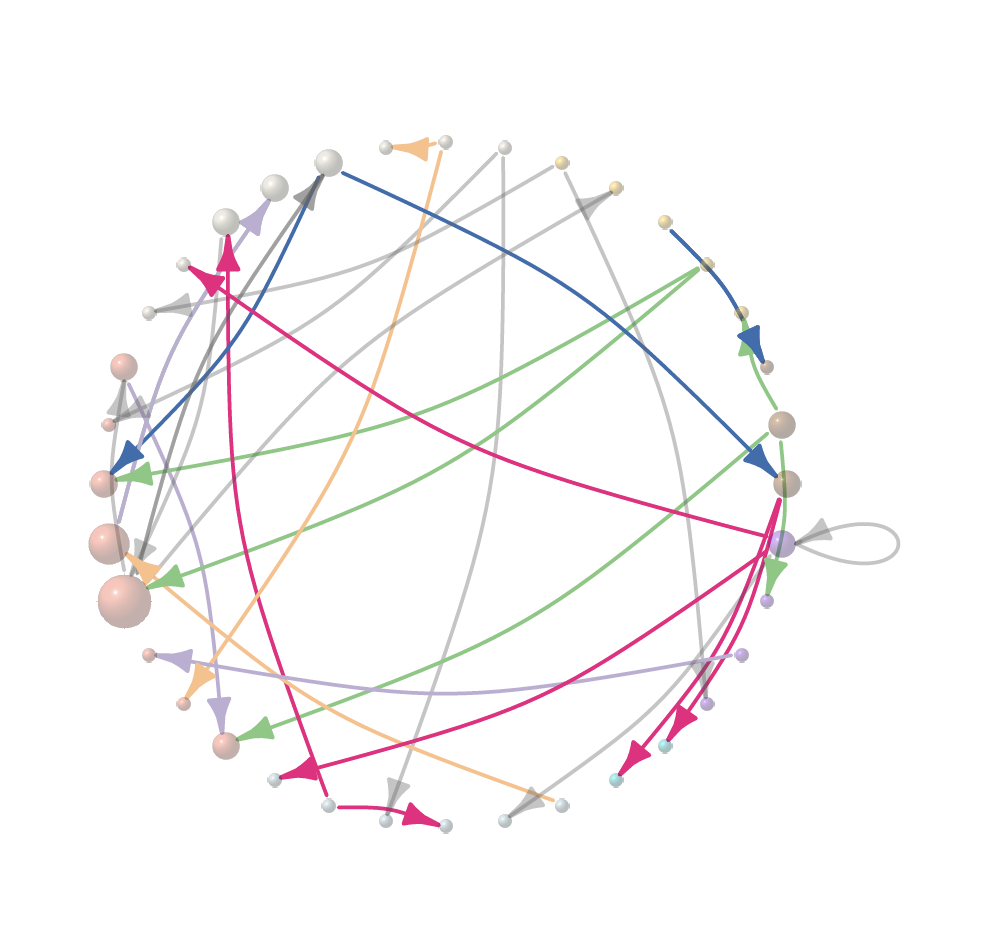
使用directed = TRUE或edge.arrow.size = 0.1(或任何大于零的值)生成的图形将生成一个顶点颜色透明的图形.它看起来像这样:
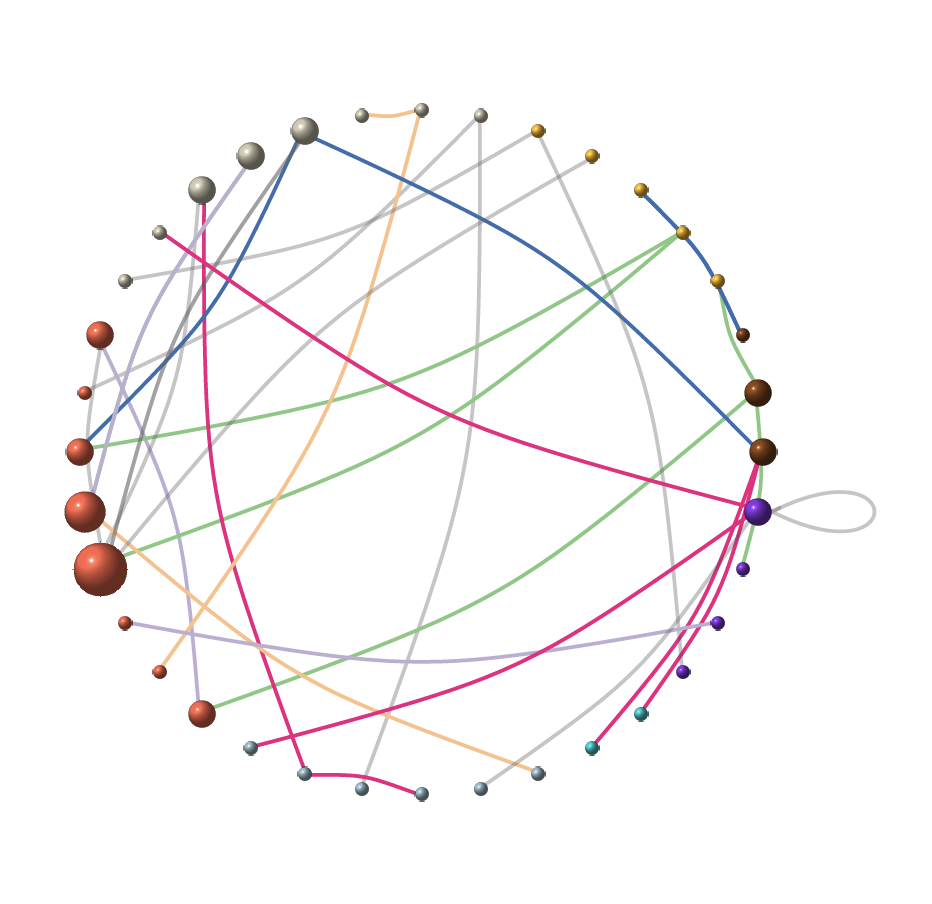
但是,当 directed = FALSE 或 edge.arrow.size = 0 时,结果图将生成一个顶点颜色为“正常”或什么的图。从这段代码中得到所需的。它看起来像这样:
我找到的最接近的解决方案可以在这篇文章中找到:Unexpected arrow color behavior with semi-transparent edges (igraph, R) .
建议减小顶点(例如 vertex.size)。但是,减小 vertex.size 仍会保留透明顶点(当 directed = TRUE 时)。此外,传递帖子中建议的 edge.arrow.mode 没有任何效果。
关于如何在graph_from_data_frame(directed = TRUE)时获取非透明顶点有什么建议吗?
最佳答案
将#66666660更改为例如#666666。即删除 #RRGGBBAA 中的 alpha channel RRGGBB60。
此问题在 Windows、Rgui 上也可以重现。
小例子
library(igraph)
stack_graph <- make_ring(2, directed=TRUE)

plot(stack_graph,
     layout = layout_in_circle(stack_graph),
     vertex.shape = "sphere",
     edge.color = c("#66666660"),   # Transparency issues are caused by non valid RBG color code.
     edge.arrow.size = 2            # Changing this flag with anything > 0 will show transparency issues of the graph vertices.
     )
编辑:如果图中的edge.color = rgb(red=0x66/255, green=0x66/255, blue=0x66/255, alpha=0.3) ()设置为透明,则保存到.pdf文件后顶点也会渲染为透明。很可能是 igraph 错误。
关于r - R 中的 igraph : Directed graphs (with arrows) causes vertex color transparency,我们在Stack Overflow上找到一个类似的问题: https://stackoverflow.com/questions/75037904/