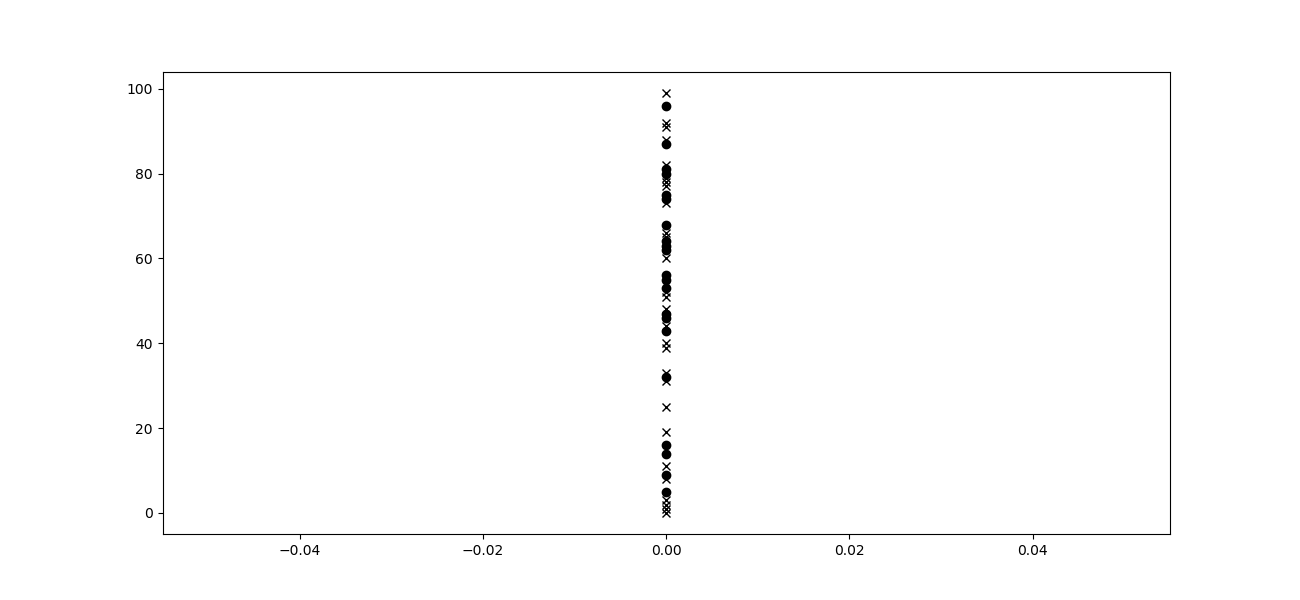
我正在尝试从数组的第 1 列创建线图。如果同一数组的第 2 列中的某个条件已完全填充,则线图的标记应发生变化(如果条件已完全填充,则标记 = 'o',如果条件为假,则标记 = 'x'。但是,我的情节不正确。
import numpy as np
import matplotlib.pyplot as plt
import random

###These are 100 random numbers
randomlist = random.sample(range(0, 100), 100)

###This is an array with 50 rows and 2 columns
arr = np.array(randomlist)
arr_re = arr.reshape(50,2)

### This is a lineplot of column 1 with different markers dependent on the value of column 2
figure, ax = plt.subplots(figsize=(13, 6))
for i in range(0,50,1):
 #figure, ax = plt.subplots(figsize=(13, 6))
 if arr_re[i,1] > 50:
  ax.plot(arr_re[i,0], color="black", marker='o', label='1880-1999')
 else:
  ax.plot(arr_re[i,0], color="black", marker='x', label='1880-1999')
plt.show()
也许有人可以给我提示。 干杯icorrect_result plot should look like this, however with changing markers according to the condition of column2
最佳答案
上面代码的主要问题是您忘记向绘图函数添加 x 值。实现目标的一种方法是首先绘制随机点的线,然后使用不同的标记绘制点的散布图。请参阅下面我对您的代码的调整。
import numpy as np
import matplotlib.pyplot as plt
import random
###These are 100 random numbers
randomlist = random.sample(range(0, 100), 100)
###This is an array with 50 rows and 2 columns
arr = np.array(randomlist)
arr_re = arr.reshape(50,2)
### This is a lineplot of column 1 with different markers dependent on the value of column 2
figure, ax = plt.subplots(figsize=(13, 6))
# plot column 1
plt.plot(arr_re[:,0])
# scatter plot the markers based on a condition
for i in range(0,50,1):
if arr_re[i,1] > 50:
ax.scatter(i,arr_re[i,0], color="black", marker='o', label='1880-1999')
else:
ax.scatter(i,arr_re[i,0], color="black", marker='x', label='1880-1999')
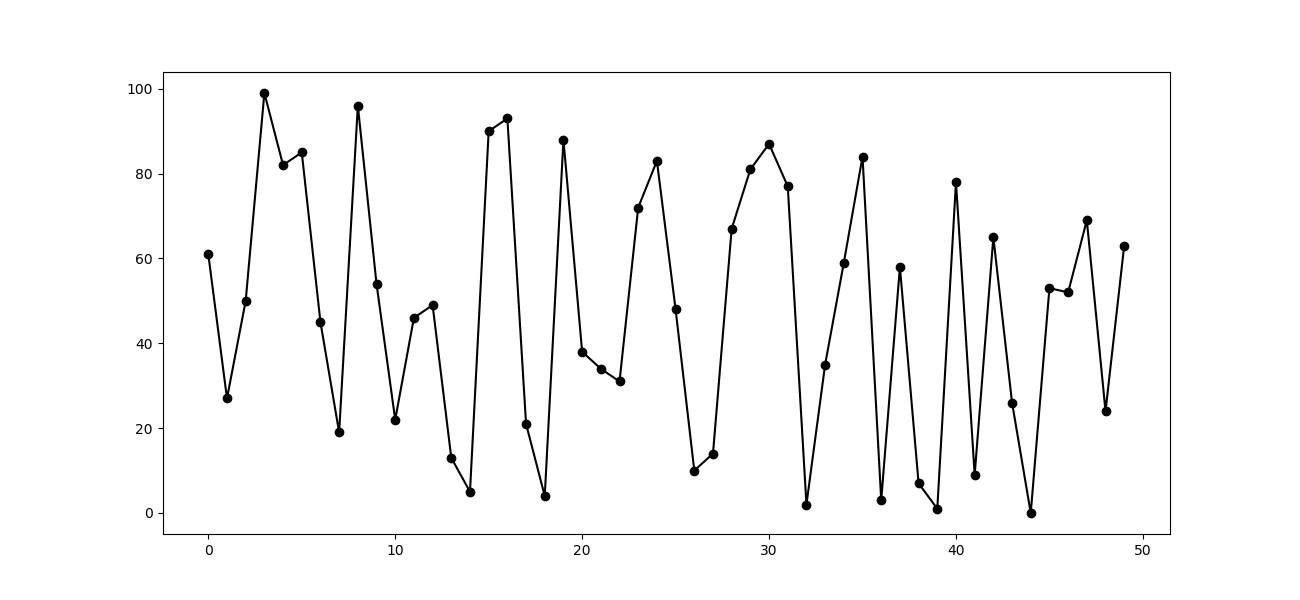
plt.show()
结果是:

关于python - 如果条件为真,则使用不同标记的线图 python 3,我们在Stack Overflow上找到一个类似的问题: https://stackoverflow.com/questions/67091286/