guides = "collect"完成其工作,但它以与图重叠的方式定位图例。我希望将它放置在空的右下角的正中间,但这似乎很困难,因为 theme(legend.position = c(X,Y))不适用于 patchwork
问题说明:
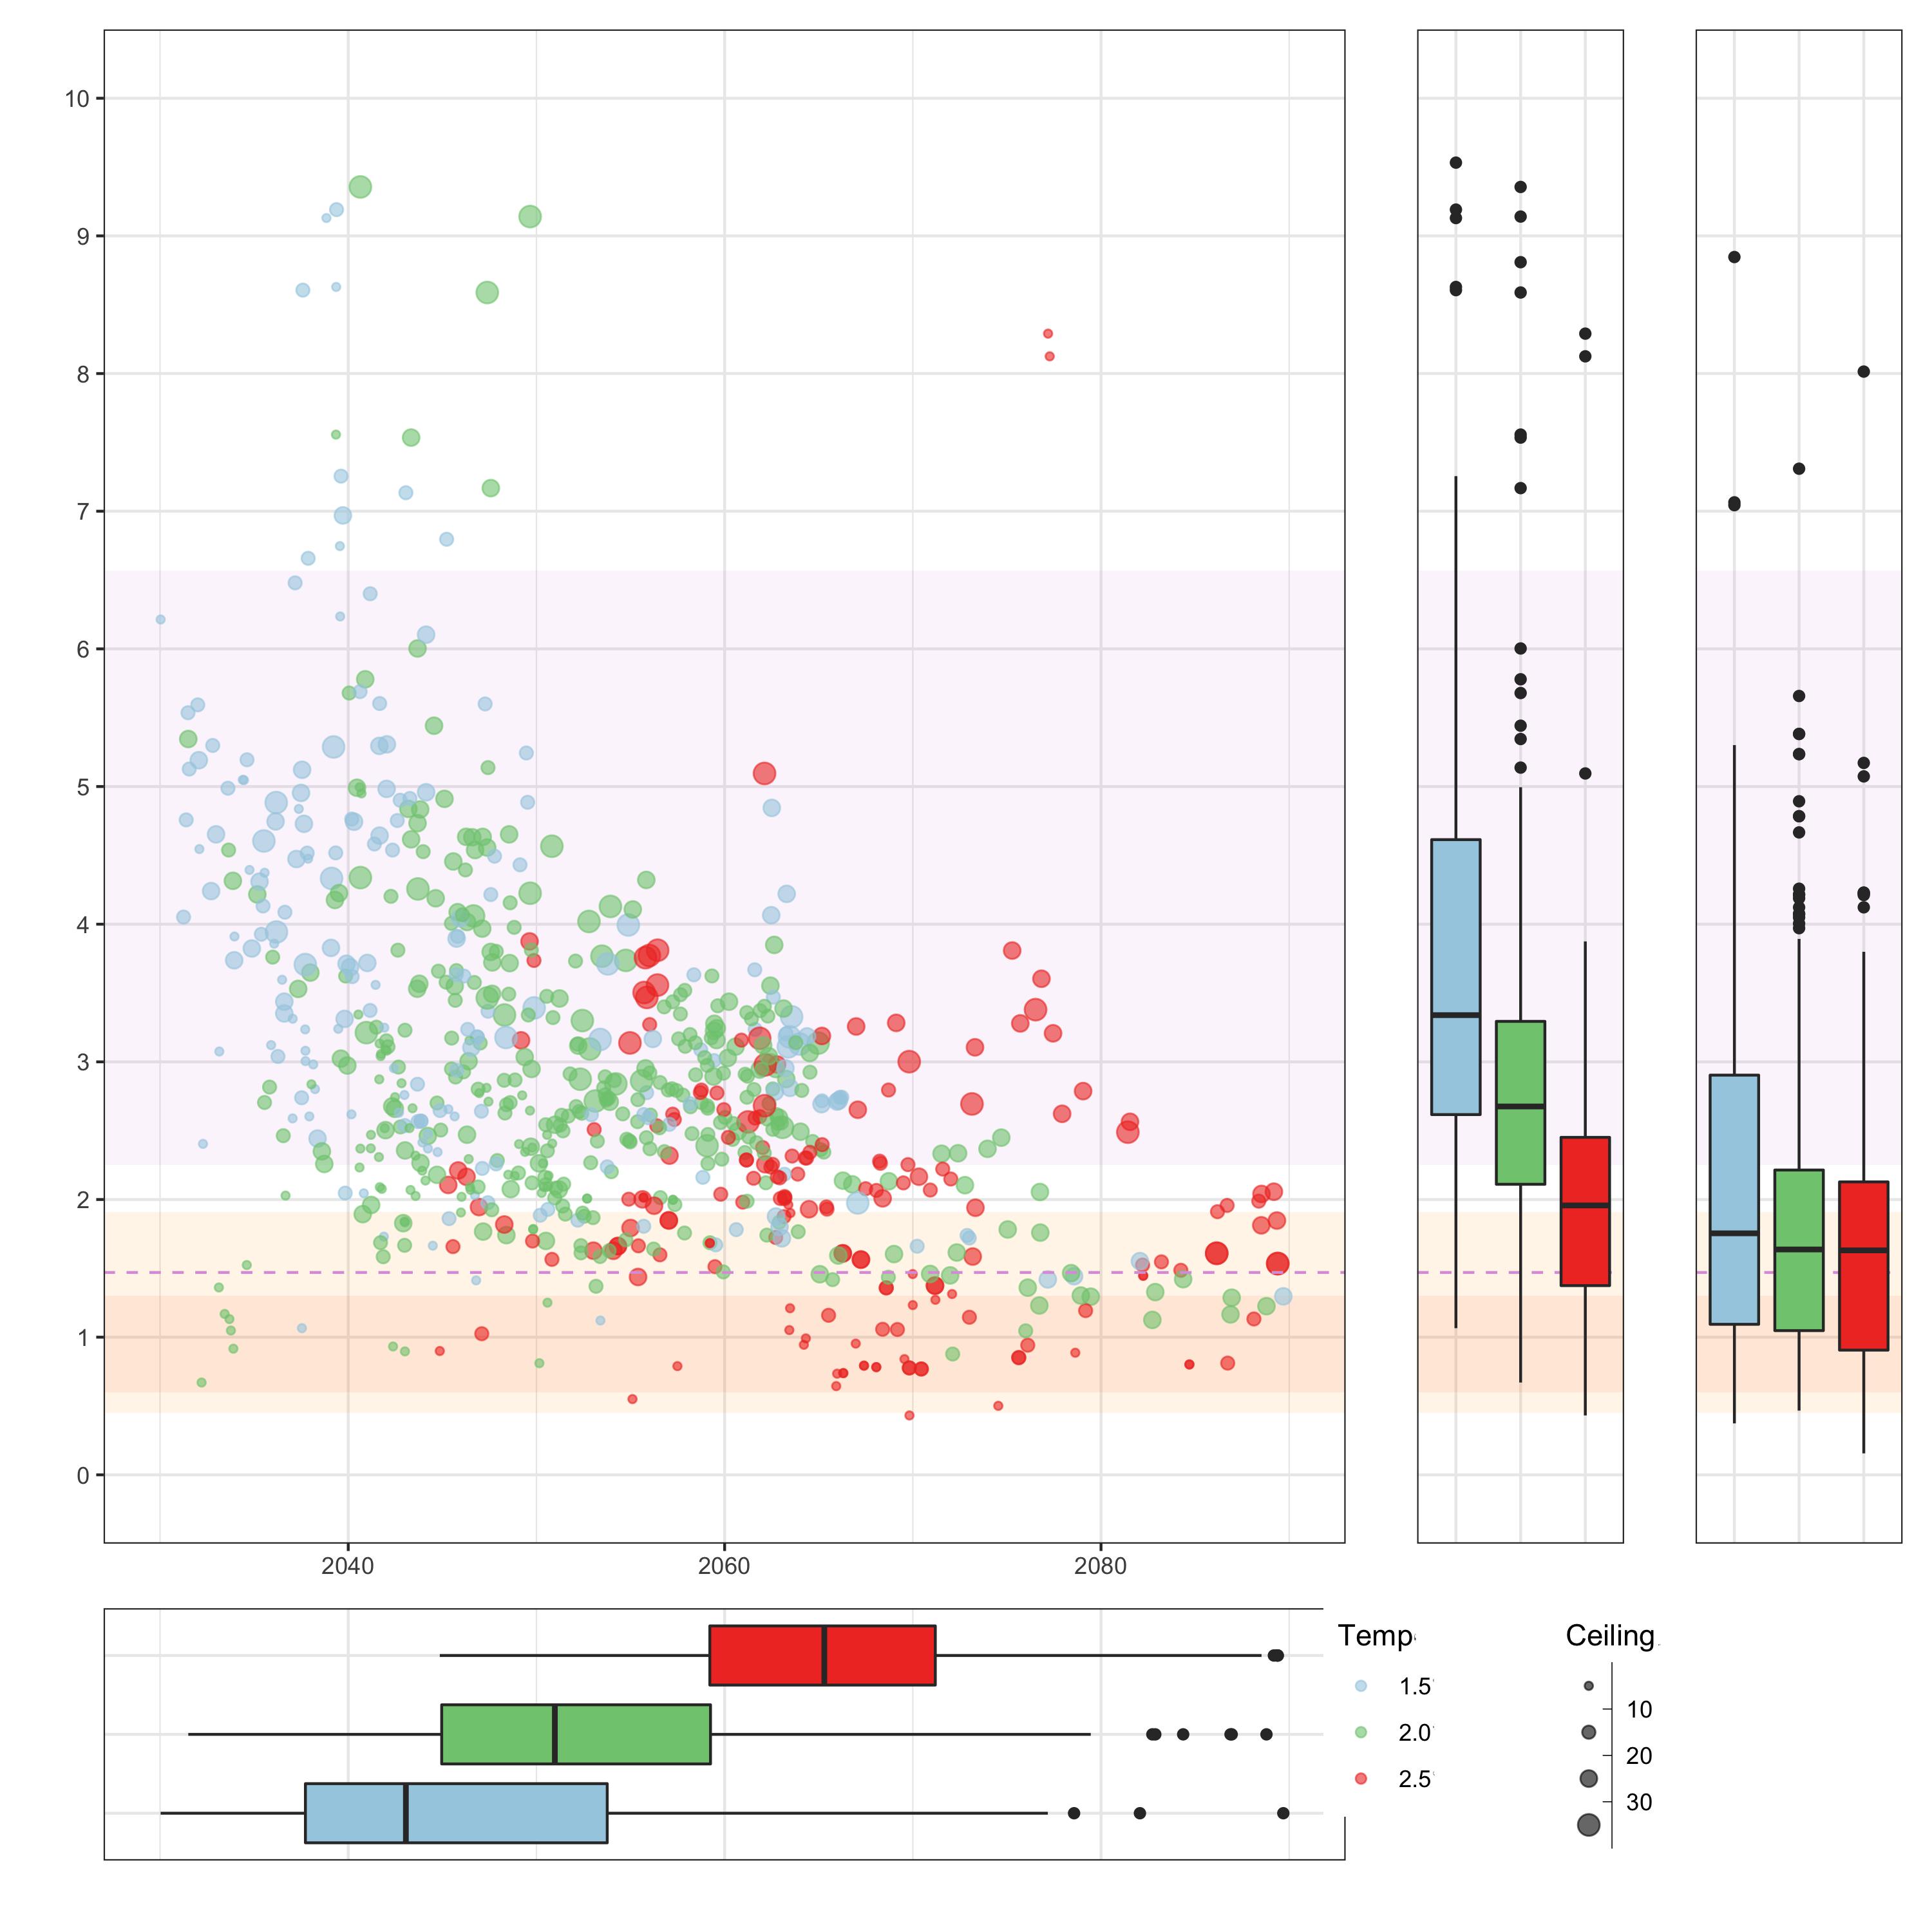
这是我使用 patchwork 组装 4 个图表的代码。很确定有一种更优雅的使用方式 theme()但我对 patchwork 很陌生到目前为止,除了图例定位之外,它对我有用。
类似的问题已解决 here但它似乎对我的情况没有帮助。
#first panel
s_wpanels_final <- (dots & theme_bw() & theme(axis.title.x =
   element_blank(), panel.grid.minor.y = element_blank())) +

#second panel
  (g_box_tmax & theme_bw() & theme(axis.text.x=element_blank(),
  axis.ticks.x=element_blank(), panel.grid.minor.y = element_blank(),
  axis.text.y=element_blank(), axis.ticks.y=element_blank(),
  axis.title.x = element_blank(), legend.position = "none")) +

#third panel
  (g_box_t0 & theme_bw() & theme(axis.text.x=element_blank(),
  axis.ticks.x=element_blank(), panel.grid.minor.y = element_blank(),
  axis.text.y=element_blank(), axis.ticks.y=element_blank(),
  axis.title.x = element_blank(),  legend.position = "none")) +

#fourth panel
  (tmax_box & theme_bw() & theme(axis.text.x=element_blank(),
  axis.ticks.x=element_blank(), axis.text.y=element_blank(),
  axis.ticks.y=element_blank(), axis.title.y = element_blank(),
  legend.position = "none")) +

  guide_area()+
  plot_layout(ncol=3, guides = "collect", widths=c(6,1,1), heights=c(6,1)) &
  theme(legend.direction = "vertical", legend.box = "horizontal")
最佳答案
您的代码有两个问题。首先使用 + 将绘图粘合在一起,然后设置 ncol=3 会将 guide_area 放置在第二行的第二列中。为了使图例居中,我建议使用 design 参数来指定绘图的布局。其次,虽然绘图面板将根据高度和宽度参数以及绘图设备的大小调整到设置的空间,但图例不会,即如果图例不适合给定的空间将与周围的面板重叠。为了解决这个问题,我建议增加第二列和第三列的宽度以及第二行的高度。但正如我所说,这也取决于绘图设备的大小。
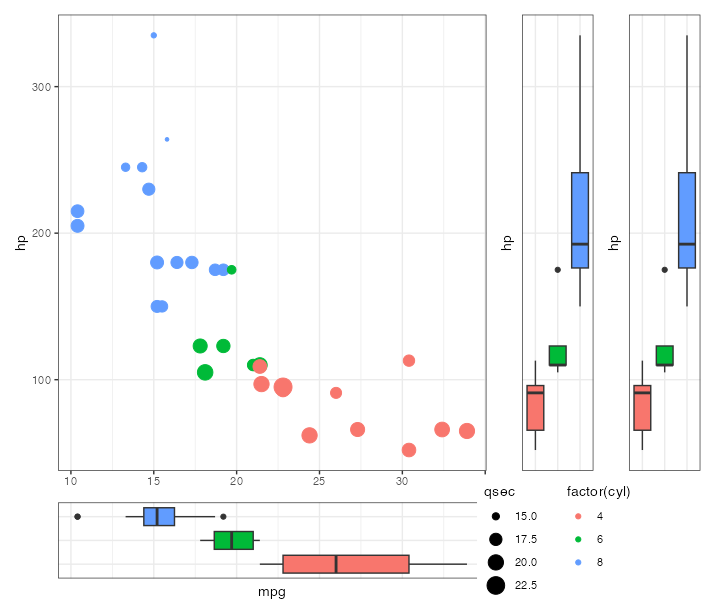
使用一些基于 mtcars 的虚假示例图(见下文),让我们首先重现您的问题:
library(ggplot2)
library(patchwork)


list(
  dots,
  g_box_tmax,
  g_box_t0,
  tmax_box,
  guide_area()
) |>
  wrap_plots() +
  plot_layout(guides = "collect", widths = c(6, 1, 1), heights = c(6, 1), ncol = 3) &
  theme(legend.direction = "vertical", legend.box = "horizontal")
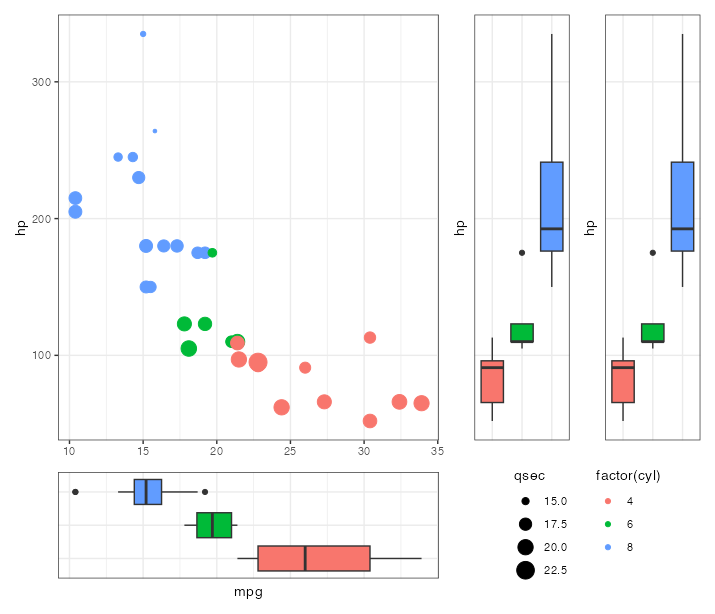
但是,通过 design 参数指定布局并增加第二行的高度以及第二列和第三列的宽度可以正常工作并将图例置于指南区域的中心:
design <-
"
ABC
DEE
"

list(
  dots,
  g_box_tmax,
  g_box_t0,
  tmax_box,
  guide_area()
) |>
  wrap_plots() +
  plot_layout(guides = "collect", widths = c(6, 1.5, 1.5), heights = c(6, 1.5), design = design) &
  theme(legend.direction = "vertical", legend.box = "horizontal")
绘图
dots <- ggplot(mtcars, aes(mpg, hp, color = factor(cyl), size = qsec)) +
  geom_point() +
  theme_bw() +
  theme(
    axis.title.x = element_blank(),
    panel.grid.minor.y = element_blank()
  )

g_box_tmax <- g_box_t0 <- ggplot(mtcars, aes(factor(cyl), hp, fill = factor(cyl))) +
  geom_boxplot() +
  theme_bw() +
  theme(
    axis.text.x = element_blank(),
    axis.ticks.x = element_blank(), panel.grid.minor.y = element_blank(),
    axis.text.y = element_blank(), axis.ticks.y = element_blank(),
    axis.title.x = element_blank(), legend.position = "none"
  )

tmax_box <- ggplot(mtcars, aes(mpg, factor(cyl), fill = factor(cyl))) +
  geom_boxplot() +
  theme_bw() +
  theme(
    axis.text.x = element_blank(),
    axis.ticks.x = element_blank(), axis.text.y = element_blank(),
    axis.ticks.y = element_blank(), axis.title.y = element_blank(),
    legend.position = "none"
  )
关于r - 使用guide_area时,图例与拼凑而成的图重叠,我们在Stack Overflow上找到一个类似的问题: https://stackoverflow.com/questions/75362996/