我正在使用 scikit-learn 将文本文档 (22000) 分类为 100 个类。我使用 scikit-learn 的混淆矩阵方法来计算混淆矩阵。
model1 = LogisticRegression()
model1 = model1.fit(matrix, labels)
pred = model1.predict(test_matrix)
cm=metrics.confusion_matrix(test_labels,pred)
print(cm)
plt.imshow(cm, cmap='binary')
这就是我的混淆矩阵的样子:
[[3962  325    0 ...,    0    0    0]
 [ 250 2765    0 ...,    0    0    0]
 [   2    8   17 ...,    0    0    0]
 ...,
 [   1    6    0 ...,    5    0    0]
 [   1    1    0 ...,    0    0    0]
 [   9    0    0 ...,    0    0    9]]
但是,我没有收到清晰易读的情节。有没有更好的方法来做到这一点?
最佳答案
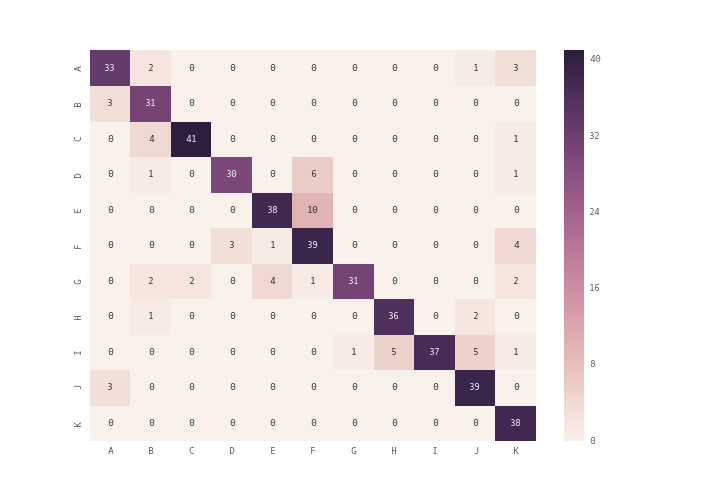
你可以使用 plt.matshow() 代替 plt.imshow() 或者你可以使用 seaborn 模块的 heatmap ( see documentation ) 绘制混淆矩阵
import seaborn as sn
import pandas as pd
import matplotlib.pyplot as plt
array = [[33,2,0,0,0,0,0,0,0,1,3],
        [3,31,0,0,0,0,0,0,0,0,0],
        [0,4,41,0,0,0,0,0,0,0,1],
        [0,1,0,30,0,6,0,0,0,0,1],
        [0,0,0,0,38,10,0,0,0,0,0],
        [0,0,0,3,1,39,0,0,0,0,4],
        [0,2,2,0,4,1,31,0,0,0,2],
        [0,1,0,0,0,0,0,36,0,2,0],
        [0,0,0,0,0,0,1,5,37,5,1],
        [3,0,0,0,0,0,0,0,0,39,0],
        [0,0,0,0,0,0,0,0,0,0,38]]
df_cm = pd.DataFrame(array, index = [i for i in "ABCDEFGHIJK"],
                  columns = [i for i in "ABCDEFGHIJK"])
plt.figure(figsize = (10,7))
sn.heatmap(df_cm, annot=True)
关于python - 如何绘制混淆矩阵?,我们在Stack Overflow上找到一个类似的问题: https://stackoverflow.com/questions/35572000/