如何更改 r car scatterplotMatrix 函数中回归线的颜色?
如果我运行这段代码:
# Load the iris dataset.
library(car)
data(iris)

# Plot #1: Basic scatterplot matrix of the four measurements
scatterplotMatrix(~Sepal.Length+Sepal.Width+Petal.Length+Petal.Width, data=iris)
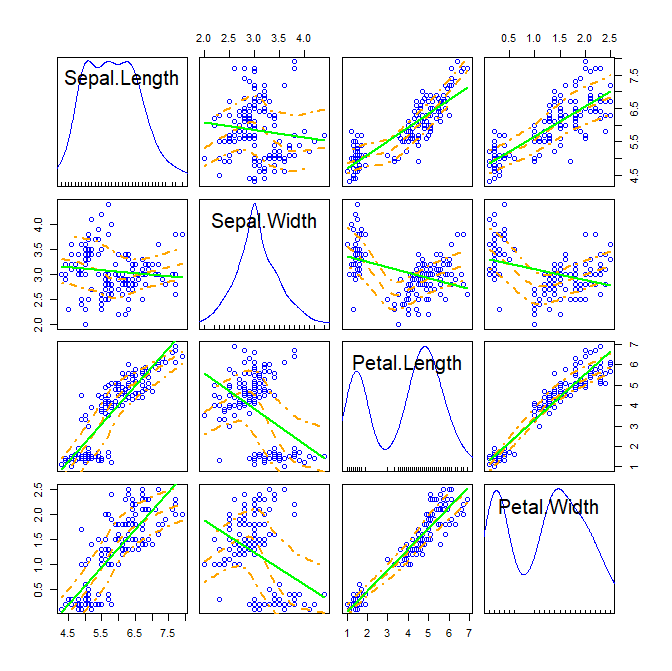
然后我得到这个情节:

检查显示点、平滑窗口和回归线都是相同的颜色,并且区分不是很清楚。
如果我想要蓝色的点、绿色的回归、橙色的平滑,我该怎么做?
最佳答案
这只需要仔细阅读文档?scatterplotMatrix。
关于颜色的部分说:
col
colors for points; the default is carPalette starting at the second color. The color of the regLine and smooth are the same as for pointsbut can be changed using the the regLine and smooth arguments.
regLine 的描述如下:
regLine=TRUE equivalent to regLine = list(method=lm, lty=1, lwd=2, col=col[1])
smooth 更复杂。描述位于详细信息部分。该描述很长,但包括:
You can also specify the colors you want to use for the mean and variance smooths with the arguments col.smooth and col.spread.
把这些放在一起,你可以得到
scatterplotMatrix(~Sepal.Length+Sepal.Width+Petal.Length+Petal.Width,
    data=iris, regLine = list(col="green"),
    smooth=list(col.smooth="orange", col.spread="orange"))
关于r - 如何在 r car scatterplotMatrix 函数中设置回归线颜色,我们在Stack Overflow上找到一个类似的问题: https://stackoverflow.com/questions/58731746/