我有以下 gnuplot 脚本:
set autoscale
unset log
unset label
unset term
unset output
set xtics rotate by -90
set ytic auto
unset title
set xlabel "Survey metadata attribute subset"
set ylabel "Accuracy of classifier (%)"
set boxwidth 0.1
set style fill solid
set term eps
set output "metadata.eps"
plot "metadata.dat" using 1:3:xtic(2) title "PART" with boxes, \
     "metadata.dat" using 1:5:xtic(2) title "JRip" with boxes, \
     "metadata.dat" using 1:7:xtic(2) title "FURIA" with boxes
但是,这会将所有 3 组条形图绘制在彼此之上,而我希望它们并排按此顺序组合在一起。所以它应该是这样的:PARTbar、JRipbar、FURIAbar、gap、PARTbar、JRipbar、FURIAbar、gap 等。我该怎么做呢?
最佳答案
我猜你想要的是set style histogram clustered。
我用最小的数据集(见底部)绘制了它
set style histogram clustered
set xtics rotate by -90
unset title
set xlabel "Survey metadata attribute subset"
set ylabel "Accuracy of classifier (%)"
set boxwidth 1
set style fill solid
set term png
set output "so.png"
plot [-0.5:2.75][1:17] "so.dat"using 3:xtic(2) title "PART" with histograms, \
     "" using 4 title "JRip" with histograms, \
     "" using 5 title "FURIA" with histograms
产生
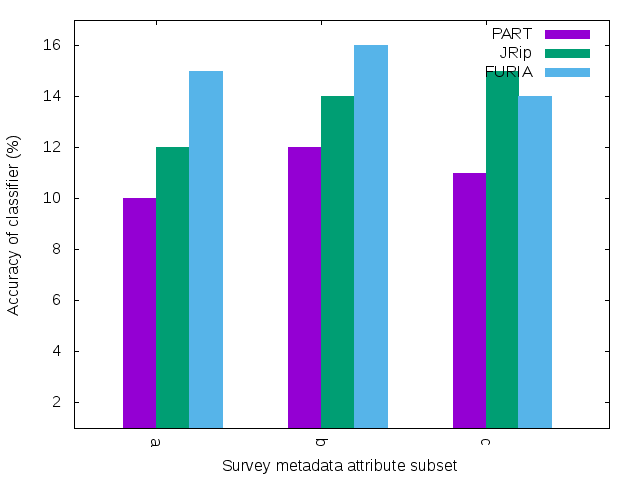
我认为您可以从这里更进一步。
数据文件“so.dat”:
1   a   10  12  15
2   b   12  14  16
3   c   11  15  14
关于gnuplot - 让 gnuplot 并排放置条形图,我们在Stack Overflow上找到一个类似的问题: https://stackoverflow.com/questions/35386969/