我正在尝试在 matplotlib 中绘制双条形图,其中 x 轴是日期值。 我的数据框如下:
+------------+----------+----------+
|            | Column A | Column B |
+------------+----------+----------+
| 2020-03-28 |        4 |      0.0 |
+------------+----------+----------+
| 2020-03-29 |      250 |     58.0 |
+------------+----------+----------+
| 2020-03-30 |       72 |     10.0 |
+------------+----------+----------+
| 2020-03-31 |       10 |      0.0 |
+------------+----------+----------+
| 2020-04-01 |        7 |      0.0 |
+------------+----------+----------+
|        ... |      ... |      ... |
+------------+----------+----------+
| 2020-05-12 |        6 |      0.0 |
+------------+----------+----------+
| 2020-05-13 |        2 |      0.0 |
+------------+----------+----------+
| 2020-05-14 |        9 |      0.0 |
+------------+----------+----------+
| 2020-05-15 |        5 |      0.0 |
+------------+----------+----------+
| 2020-05-16 |       35 |      1.0 |
+------------+----------+----------+
I wish to plot it with a bar plot, with the following code:
g.plot.bar()
ax = plt.gca()
ax.set_yscale('log')
ax.xaxis_date()
ax.xaxis.set_major_formatter(mdates.DateFormatter('%m-%d'))
最后一行是为 x 轴中的刻度设置格式化程序,因为如果没有,它将显示整个月中的所有日期。当我尝试这样做时,它引发了以下异常:
ValueError: DateFormatter found a value of x=0, which is an illegal date; this usually occurs because you have not informed the axis that it is plotting dates, e.g., with ax.xaxis_date()
我已经搜索了很多这个错误,但我无法弄清楚代码/数据出了什么问题......
最佳答案
据说 pandas 不能很好地处理自定义日期格式。
所以我们可以改用基础 matplotlib。
这个其他的答案帮助了我:https://stackoverflow.com/a/59739281/42346
import matplotlib.pyplot as plt, numpy as np, matplotlib.dates as mdates

x = mdates.datestr2num(g.index.strftime('%m-%d'))
w = 0.25
fig = plt.figure(figsize=(8, 4))
ax = fig.add_subplot(111)
ax.bar(x - w, g['Column A'], width=2 * w, align='center')
ax.bar(x + w, g['Column B'], width=2 * w, align='center')
ax.xaxis_date()
ax.xaxis.set_major_locator(mdates.AutoDateLocator())
ax.xaxis.set_major_formatter(mdates.DateFormatter("%m-%d"))
plt.show()
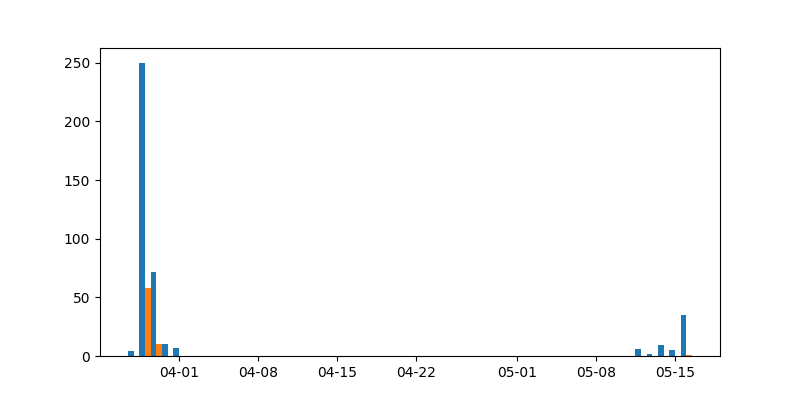
结果:
关于python - Error DateFormatter found a value of x=0, 这是 matplotlib 条形图中的非法日期,我们在Stack Overflow上找到一个类似的问题: https://stackoverflow.com/questions/61966334/