我制作了这个 3d 条形图,但我发现某些条形重叠错误,如下图中绿色圆圈所示: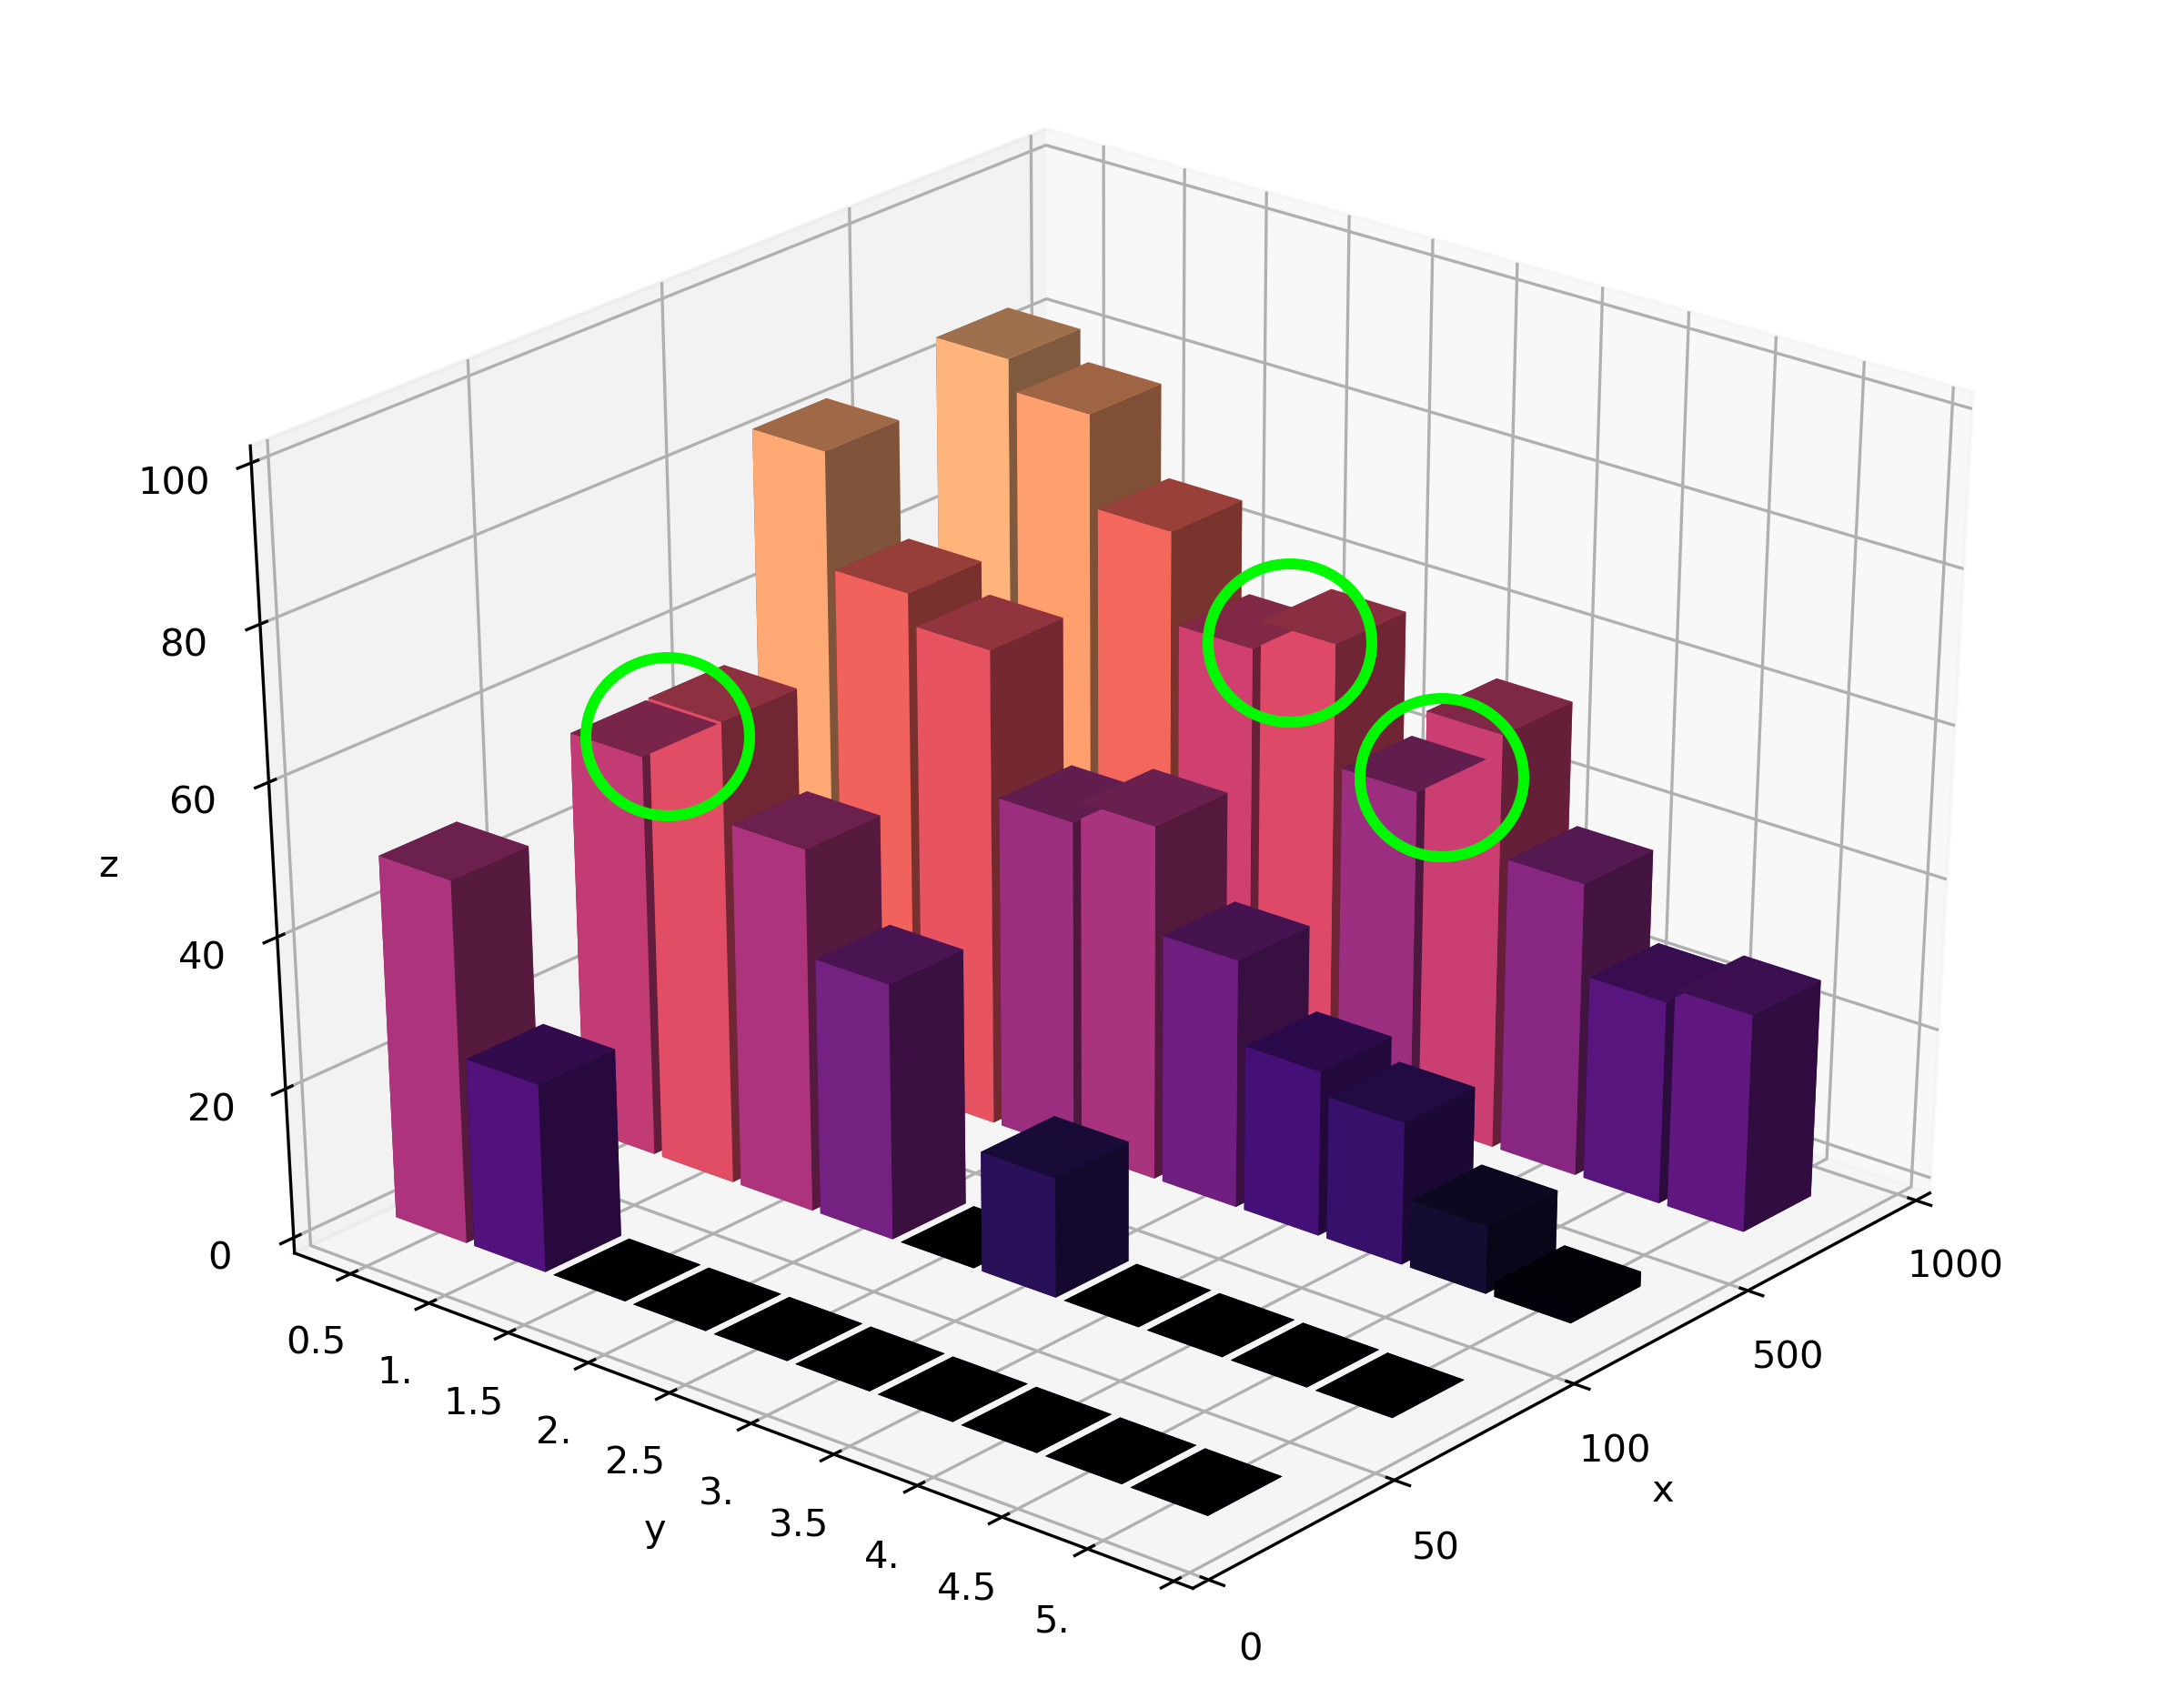
剧情制作者:
import matplotlib.pyplot as plt
import numpy as np
from mpl_toolkits.mplot3d.axes3d import Axes3D
import matplotlib.colors as colors

fig = plt.figure(figsize=(10,8))
ax = fig.add_subplot(111, projection='3d')
matrix = np.array([
[84 80 68 56 60 44 55 39 27 29]
[82 67 63 44 47 33 22 19  9  2]
[53 61 48 34  0 16  0  0  0  0]
[48 25  0  0  0  0  0  0  0  0]])

len_x, len_y = matrix.shape
_x = np.arange(len_x)
_y = np.arange(len_y)

xpos, ypos = np.meshgrid(_x, _y)
xpos = xpos.flatten('F')
ypos = ypos.flatten('F')
zpos = np.zeros_like(xpos)

dx = np.ones_like(zpos)
dy = dx.copy()
dz = matrix.flatten()

cmap=plt.cm.magma(plt.Normalize(0,100)(dz))

ax.bar3d(xpos+0.32, ypos-0.3, zpos, dx-0.6, dy-0.1, dz, zsort='max', color=cmap)

ax.set_xlabel('x')
ax.set_xticks(np.arange(len_x+1))
ax.set_xticklabels(['1000','500','100','50','0'])
ax.set_xlim(0,4)
ax.set_ylabel('y')
ax.set_yticks(np.arange(len_y+1))
ax.set_yticklabels(['0.5','1.','1.5','2.','2.5','3.','3.5','4.','4.5','5.'])
ax.set_ylim(-0.5,10)
ax.set_zlabel('z')
ax.set_zlim(0,100)
ax.view_init(ax.elev, ax.azim+100)
这是一个错误吗?为什么有些条严重重叠? 我正在使用 matplotlib 版本 2.1.0 和 anaconda python 3.6.3
最佳答案
正如@DavidG 在评论中指出的,这是一个没有理想解决方案的问题:
My 3D plot doesn’t look right at certain viewing angles
This is probably the most commonly reported issue with mplot3d. The problem is that – from some viewing angles – a 3D object would appear in front of another object, even though it is physically behind it. This can result in plots that do not look “physically correct.”Unfortunately, while some work is being done to reduce the occurrence of this artifact, it is currently an intractable problem, and can not be fully solved until matplotlib supports 3D graphics rendering at its core.
[Source]
但是,通过调整图表的视角并减少条形之间的接触面积,我能够大大减少这个问题。
例如,要改变视角(“相机位置”),我使用了:
ax.view_init(elev=30, azim=-60) # Changes the elevation and azimuth
更多详情请参见 how to set “camera position” for 3d plots using python/matplotlib?
根据接触区域,这取决于您的情节。在我的例子中,所有的条都沿着 y 轴接触,所以我只是稍微减少了 dy 参数以在条之间留下一些间隙。
关于python - bar3d 图中的错误重叠,我们在Stack Overflow上找到一个类似的问题: https://stackoverflow.com/questions/53611716/