我有一个包含 109 列和大约 3000 行的数据。我想绘制 x1 到 x108 的平均值(忽略 y 和 z),数据如下所示:
时间 x1 y1 z1 x2 y2 z2 x3 y3 z4 ...x108 y108 z108
只需几列就可以很好地工作,例如:
时间 x1 y1 z1 x2 y2 z2 x3 y3 z3
用 ls 4 行绘制 'file.dat' u 1:(($2+$5+$8)/3)
但是当数据较大时,例如 108 列或更多,问题就会出现。我不想手动执行,因为稍后数据会变大。
我已经尝试过:
[i=2:108:3] 'file.dat' u 1:(column(i)) 的绘图,其中第 4 行为 ls 4
但是我会得到每个组合的图,这不是我想要的。那么,我怎样才能只绘制 x1 ... x108 的平均值(忽略 y 和 z)?
谢谢。
最佳答案
以下内容应该可以满足您的要求。下面的示例对 z1, ..., z3 求平均值。在您的情况下,平均 x1, ..., x108 的参数将为 ColStart=2、ColStep=3 和 ColCount =108。
另请检查帮助求和。
代码:
### average over several columns
reset session
$Data <<EOD
#n x1 y1 z1 x2 y2 z2 x3 y3 z3
1 1.11 1.21 1.31 2.11 2.21 2.31 3.11 3.21 3.31
2 1.12 1.22 1.32 2.12 2.22 2.32 3.12 3.22 3.32
3 1.13 1.23 1.33 2.13 2.23 2.33 3.13 3.23 3.33
4 1.14 1.24 1.34 2.14 2.24 2.34 3.14 3.24 3.34
5 1.15 1.25 1.35 2.15 2.25 2.35 3.15 3.25 3.35
6 1.16 1.26 1.36 2.16 2.26 2.36 3.16 3.26 3.36
7 1.17 1.27 1.37 2.17 2.27 2.37 3.17 3.27 3.37
8 1.18 1.28 1.38 2.18 2.28 2.38 3.18 3.28 3.38
9 1.19 1.29 1.39 2.19 2.29 2.39 3.19 3.29 3.39
EOD
ColStart = 4
ColStep = 3
ColCount = 3
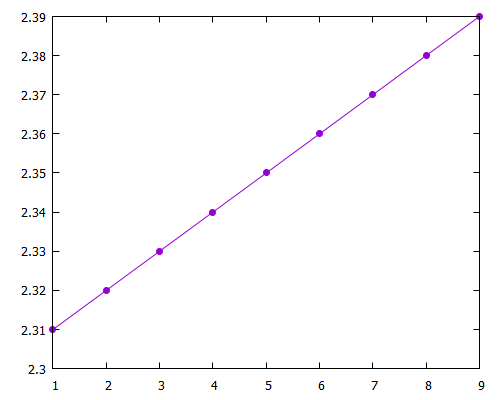
plot $Data u 1:((sum[i=0:ColCount-1] column(i*ColStep+ColStart))/ColCount) w lp pt 7 notitle
### end of code
结果:
关于gnuplot:绘制增量列的平均值,我们在Stack Overflow上找到一个类似的问题: https://stackoverflow.com/questions/60110235/