我有一个名为 tibble 的 my_data 数据框,如下所示:
> my_data
# A tibble: 60 x 4
   SPECIES       simulation_id psi_hat p_hat
   <chr>                 <int>   <dbl> <dbl>
 1 Grey squirrel            74   0.527 0.306
 2 Grey squirrel           102   0.526 0.316
 3 Grey squirrel           142   0.527 0.309
 4 Grey squirrel           121   0.527 0.309
 5 Grey squirrel            25   0.526 0.317
 6 Grey squirrel            50   0.527 0.309
 7 Grey squirrel            67   0.491 0.326
 8 Grey squirrel            19   0.527 0.306
 9 Grey squirrel           174   0.527 0.302
10 Grey squirrel            46   0.527 0.309
# ... with 50 more rows
SPECIES 中有三种不同的 my_data 。
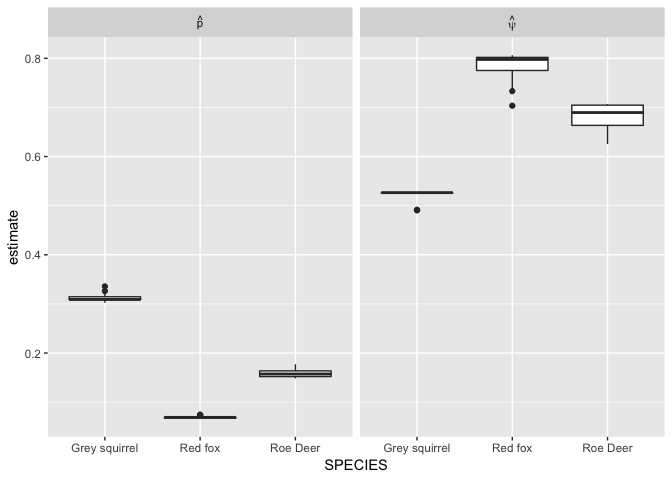
我想为每个 psi_hat 制作 p_hat 和 SPECIES 变量的箱线图。我首先像这样准备我的 tibble :
my_data_plot <- my_data %>%
    gather("psi_hat", "p_hat", key = "parameter", value = "estimate")
然后像这样绘制它:
ggplot(data = my_data_plot, mapping = aes(x = SPECIES)) +
    geom_boxplot(mapping = aes(y = estimate)) +
    facet_grid(. ~ parameter)
这给了我:

我现在想做的是将面标记为实际的希腊符号,而不是例如“psi_hat”,以便“psi_hat”将获得与构面标签中的 expression(hat(psi)) 等效的符号。
我知道在 facet_grid 中我可以使用 labeller = label_parse ,但这意味着我的变量名称必须是实际表达式,但当变量名称必须是函数调用(即 hat(psi) )时我不知道该怎么做。例如,我尝试了 my_data <- my_data %>% rename(hat(psi) = "psi_hat") 这给了我这个错误:
Error: unexpected '=' in:
"my_data <- my_data %>%
    rename(hat(psi) ="
我还考虑过 labeller = bquote ,但这似乎要求我在该图中只有列时指定行和列。
所以,我想知道是否需要或有办法为这些方面标签手动定义表达式?或者有更多的算法方法来实现这一点吗?
谢谢!
这是 dput() 的 my_data :
structure(list(SPECIES = c("Grey squirrel", "Grey squirrel",
"Grey squirrel", "Grey squirrel", "Grey squirrel", "Grey squirrel",
"Grey squirrel", "Grey squirrel", "Grey squirrel", "Grey squirrel",
"Grey squirrel", "Grey squirrel", "Grey squirrel", "Grey squirrel",
"Grey squirrel", "Grey squirrel", "Grey squirrel", "Grey squirrel",
"Grey squirrel", "Grey squirrel", "Red fox", "Red fox", "Red fox",
"Red fox", "Red fox", "Red fox", "Red fox", "Red fox", "Red fox",
"Red fox", "Red fox", "Red fox", "Red fox", "Red fox", "Red fox",
"Red fox", "Red fox", "Red fox", "Red fox", "Red fox", "Roe Deer",
"Roe Deer", "Roe Deer", "Roe Deer", "Roe Deer", "Roe Deer", "Roe Deer",
"Roe Deer", "Roe Deer", "Roe Deer", "Roe Deer", "Roe Deer", "Roe Deer",
"Roe Deer", "Roe Deer", "Roe Deer", "Roe Deer", "Roe Deer", "Roe Deer",
"Roe Deer"), simulation_id = c(74L, 102L, 142L, 121L, 25L, 50L,
67L, 19L, 174L, 46L, 162L, 31L, 199L, 147L, 163L, 18L, 170L,
172L, 106L, 157L, 158L, 200L, 187L, 103L, 144L, 77L, 78L, 139L,
75L, 57L, 171L, 195L, 90L, 136L, 109L, 30L, 152L, 97L, 74L, 8L,
161L, 73L, 130L, 151L, 150L, 184L, 198L, 177L, 97L, 88L, 123L,
190L, 83L, 75L, 143L, 159L, 103L, 16L, 200L, 2L), psi_hat = c(0.526863413764263,
0.525835491514182, 0.526515540307052, 0.526515540305866, 0.525668605170743,
0.526515540309525, 0.491205525300549, 0.526863413760793, 0.527216807861263,
0.526515540305866, 0.526515540306427, 0.526003604543373, 0.526003604547465,
0.527039406294591, 0.491512271725946, 0.526343604414775, 0.526515540311415,
0.490421555053814, 0.526003604541449, 0.526688801109048, 0.79766843868635,
0.801911295111649, 0.797668438685209, 0.79766843868356, 0.736091175845588,
0.801911294988272, 0.797668438684876, 0.797668438686537, 0.764665429923081,
0.806326437262252, 0.769630414385322, 0.806326437300003, 0.733141462334417,
0.801911295128621, 0.777085591061084, 0.801911295171974, 0.703578316906639,
0.777085591642251, 0.793615265014951, 0.806326437459794, 0.662677377511043,
0.701654360968483, 0.704629679152389, 0.70622149033349, 0.663754148939585,
0.704629679094459, 0.705416487515374, 0.677464341430293, 0.707045218951227,
0.662338556587023, 0.674456696561803, 0.701654360967044, 0.639650521202062,
0.625380503760432, 0.704629679094605, 0.664561357366103, 0.704629679143759,
0.636859548660175, 0.66375414894085, 0.707045219029558), p_hat = c(0.305763297214646,
0.315819064091298, 0.309115591855344, 0.309115591855175, 0.317494717397372,
0.309115591855145, 0.326303719905328, 0.305763297214592, 0.302410595448716,
0.309115591855175, 0.309115591855139, 0.314143327866378, 0.314143327866402,
0.304086998925611, 0.322825888575185, 0.310791594807592, 0.309115591855151,
0.335654773573103, 0.314143327866529, 0.307439493743849, 0.0690109229482788,
0.0677020110780009, 0.0690109229483345, 0.0690109229474338, 0.0744703724155286,
0.0677020110840996, 0.0690109229257095, 0.0690109229256593, 0.0704604468308165,
0.0663903378649822, 0.0691283355131073, 0.0663903378091044, 0.0737444081467713,
0.0677020110873479, 0.0665479524846632, 0.0677020110750217, 0.073966658329169,
0.0665479525245426, 0.0703192747621257, 0.0663903375835434, 0.166196509352831,
0.157146399287494, 0.152026850762839, 0.14946227707946, 0.163675003941755,
0.152026850344473, 0.150744974403108, 0.15740696035152, 0.148178744896067,
0.167783160277052, 0.162569260757996, 0.157146399287514, 0.162501076719809,
0.177160578693552, 0.152026850344548, 0.162149934290892, 0.152026850679299,
0.168221557280052, 0.163675003941561, 0.148178745461308)), class = c("tbl_df",
"tbl", "data.frame"), row.names = c(NA, -60L))
最佳答案
你可以试试这个。由于您的数据采用长格式,因此我使用 case_when 使用贴标机读取的表达式来重命名变量
library(tidyverse)

df %>%
    gather(key = "parameter", value = "estimate", -SPECIES, -simulation_id) %>%
  mutate(parameter = case_when(
    parameter == "psi_hat" ~ "hat(psi)",
    parameter == "p_hat" ~ "hat(p)"
  )) %>%
  ggplot(aes(x = SPECIES)) +
    geom_boxplot(mapping = aes(y = estimate)) +
    facet_grid(. ~ parameter, labeller = label_parsed)
由reprex package于2018年8月18日创建(v0.2.0)。
关于r - ggplot2 - 手动指定箱线图分面标签作为符号/数学表达式,我们在Stack Overflow上找到一个类似的问题: https://stackoverflow.com/questions/51909072/