我正在尝试绘制一个缩放的插图,其中包含显示绘图的哪一部分已缩放的线条和框。
这在 R 中可能吗?
This是我想用 Python 完成的示例。
一些示例代码:
    p <-
  qplot(1:10, 1:10)
g <-
  p +
  coord_cartesian(ylim = c(8, 10), xlim = c(8, 10)) +
  theme(axis.title.x = element_blank(),
        axis.title.y = element_blank())
p +
  annotation_custom(
    grob = ggplotGrob(g),
    xmin = 7,
    xmax = 10,
    ymin = 1,
    ymax = 5
  )
最佳答案
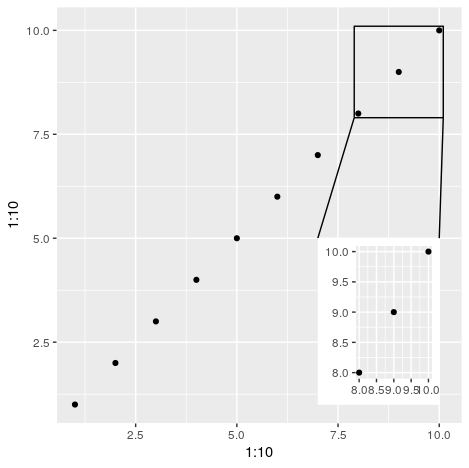
也许下面的代码可以完成问题的要求。或者,至少,它给出了解决问题的思路。
放大的区域显示为geom_path绘制一个矩形,连接线为geom_line。为此,创建了两个新数据集,给出了正方形的顶点和直线的端点。
polydata <- data.frame(x = c(7.9, 10.1, 10.1, 7.9, 7.9),
                       y = c(7.9, 7.9, 10.1, 10.1, 7.9))
linedata <- data.frame(x = c(7.9, 7, 10.1, 10),
                       y = c(7.9, 5, 7.9, 5),
                       id = c("a", "a", "b", "b"))
p +
  geom_path(data = polydata, aes(x, y)) +
  geom_line(data = linedata, aes(x, y, group = id),
            linetype = "solid") +
  annotation_custom(
    grob = ggplotGrob(g),
    xmin = 7,
    xmax = 10,
    ymin = 1,
    ymax = 5
  )
如果使用采用自定义值的 plot.background 重新定义插图,则结果可以变得更漂亮。
g <-
  p +
  coord_cartesian(ylim = c(8, 10), xlim = c(8, 10)) +
  theme(axis.title.x = element_blank(),
        axis.title.y = element_blank(),
        plot.background = element_rect(colour = "black", fill = NA, size = 1))

关于r - 绘制带有正方形和线条的图的放大插图图,我们在Stack Overflow上找到一个类似的问题: https://stackoverflow.com/questions/60026583/