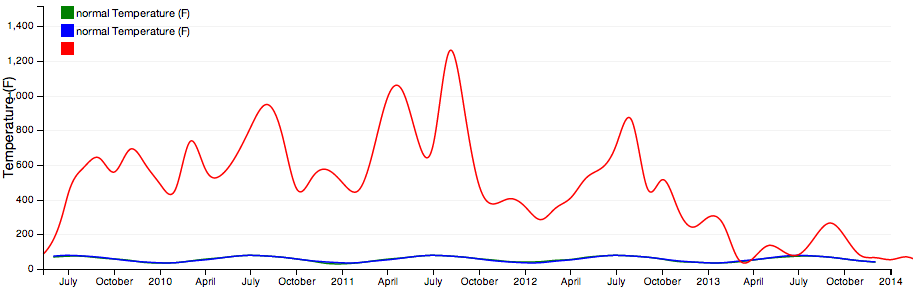
我有一个由三个折线图组成的复合图表。其中一张图表按照建议使用“假”组 here.正如您在下面的快照中所看到的,尽管第三张图表的比例与其他两张图表有很大不同。我想要的解决方案是有一个如图所示的双轴图表 here in pure d3.我认为可以在主复合图表上使用 .renderlet() 来完成,但我想知道是否有纯 dc.js 的“更性感”解决方案?
这是一个快照:
这是我的代码。 (在 coffeescript 中)我尝试在内部图表上使用 .y 和 .yAxis,但没有效果。
    actualValuesChart = dc.lineChart(mainChart)
        .group(metric, "actual " + @displayName)
        .valueAccessor (d) -> d.value.avg
        .colors(['green'])
        .interpolate('basis-open')

    normValuesChart = dc.lineChart(mainChart)
        .group(metric, "normal " + @displayName)
        .valueAccessor (d) -> d.value.avg_avg
        .colors(['rgba(0,0,255,1)'])
        .interpolate('basis-open')

    clipsCountChart = dc.lineChart(mainChart)
        .group(buildFakeGroup(defaultClipsArray))
        .colors(['red'])
        .interpolate('basis-open')
        # .y(d3.scale.linear().range([100, 0]))
        # .yAxis(d3.svg.axis().scale(d3.scale.linear().range([100, 0])))

    mainChart
        .dimension(@dimension.monthStamp)
        .width(thisChart.width + 30)
        .height(thisChart.width*.333)
        .yAxisLabel(@displayName)
        .elasticY(true)
        .x(d3.time.scale().domain([minDate,maxDate]))
        .xUnits(d3.time.months)
        .brushOn(true)
        .legend(dc.legend().x(60).y(10).itemHeight(13).gap(5))
        .renderHorizontalGridLines(true)
        .compose([actualValuesChart,normValuesChart,clipsCountChart])
最佳答案
是的!这是一个非常新的功能,我自己还没有尝试过,但是如果您使用 useRightYAxis 创建一些子图表, 然后设置 rightY对于复合图表上的第二个刻度,您应该得到您要找的东西。
但这完全是前沿技术,我看到该示例目前已损坏 (web/examples/right-axis.html)。所以遇到问题请跟进creating an issue或开始讨论 on the user group .
关于d3.js - dc.js 中的双 Y 轴折线图,我们在Stack Overflow上找到一个类似的问题: https://stackoverflow.com/questions/24947137/