我有以下数据集:
import pandas as pd
import numpy as np
%matplotlib inline

df = pd.DataFrame({'movie' : ['A', 'B','C','D'],
                   'genres': ['Science Fiction|Romance|Family', 'Action|Romance',
                              'Family|Drama','Mystery|Science Fiction|Drama']},
                  index=range(4))
df
我的尝试
# Parse unique genre from all the movies
gen = []
for g in df['genres']:
    gg = g.split('|')
    gen = gen + gg
    gen = list(set(gen))

print(gen)

df['genres'].value_counts().plot(kind='pie')
我得到了这张图片:

但我想为每个单独的流派制作饼图。
我们如何获得每个独特类型的电影数量的类型?
最佳答案
所以,单线解决方案:
df.genres.str.get_dummies().sum().plot.pie(label='Genre', autopct='%1.0f%%')
结果:

TL;博士
首先,将您的类别列转换为虚拟对象:
df = pd.concat([df.drop('genres', axis=1), df.genres.str.get_dummies()], axis=1)
结果:
  movie  a  b  c  d  e  f  g
0     A  1  1  1  0  0  0  0
1     B  0  0  1  0  1  0  0
2     C  0  0  0  0  0  1  1
3     D  1  1  0  1  1  0  0
然后计算每个类别的出现次数:
counts = df.drop('movie', axis=1).sum()
结果:
a    2
b    2
c    2
d    1
e    2
f    1
g    1
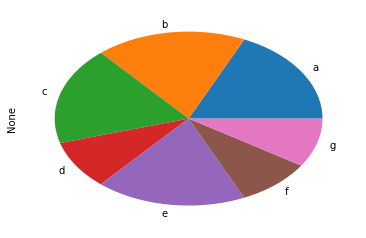
最后绘制饼图:
counts.plot.pie()
关于python - pandas:如何在 Pandas 中绘制电影数量与 IMDB 电影类型的饼图?,我们在Stack Overflow上找到一个类似的问题: https://stackoverflow.com/questions/52132970/