我在 server.R 中有以下代码:
library(shiny)
library(plotly)
art.data <- read.csv("data1.csv", stringsAsFactors = FALSE)
shinyServer(function(input, output) {
output$distPlot <- renderPlotly({
col.str <- paste0(input$colspa, ".", input$rgbchoice, ".median")
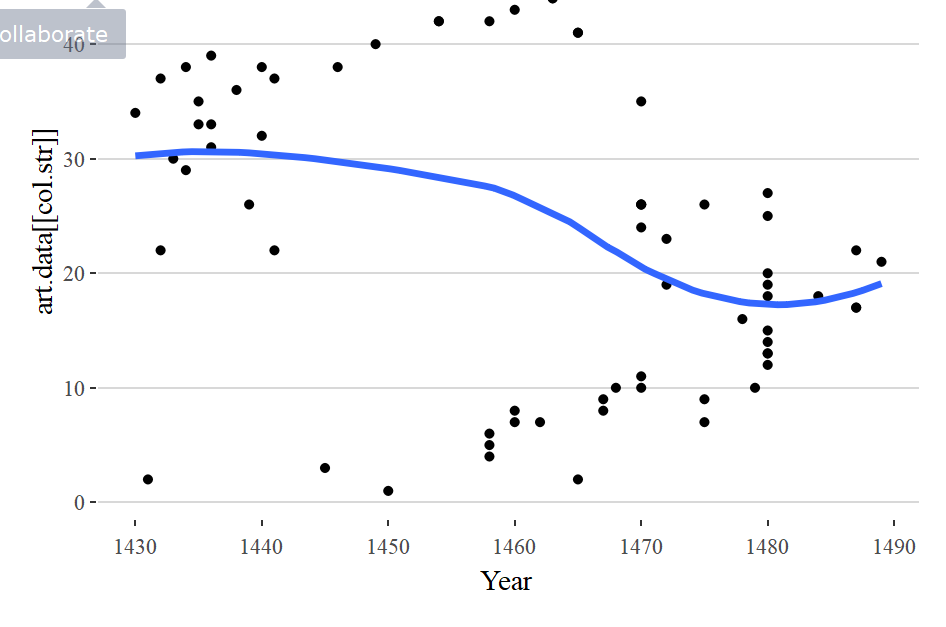
p <- ggplot(art.data, aes(x = year, y = art.data[[col.str]], text = paste0(artist, "<br>", art))) + geom_point(size = 1) + xlab("Year") + stat_smooth(method = loess, se = FALSE)
ggplotly(p , tooltip = "text")
})
})
如果我删除工具提示,则输出图中存在回归线,但包含工具提示时,回归线不会出现在图中。有什么解决方案可以将两者结合在一起?
With tooltip
Without tooltip in ggplotly() and text in aes()
最佳答案
审美 text需要审美 group .
让我们开始考虑这个例子:
art.data <- data.frame(year=1430:1490, y=rnorm(61),
artist=sample(LETTERS,61, replace=T), art=sample(letters,61, replace=T))
col.str <- 2
library(ggplot2)
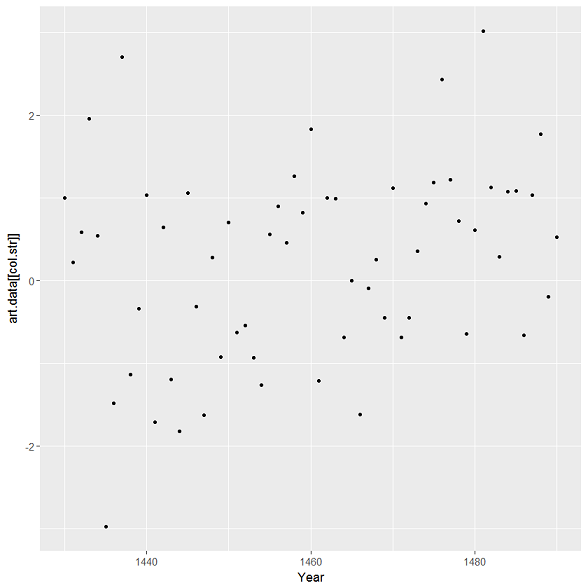
ggplot(art.data, aes(x = year, y = art.data[[col.str]],
text=paste0(artist, "<br>", art))) +
geom_point(size = 1) +
stat_smooth(method = loess, se = FALSE) +
xlab("Year")
在这种情况下,黄土线没有绘制在图表上:
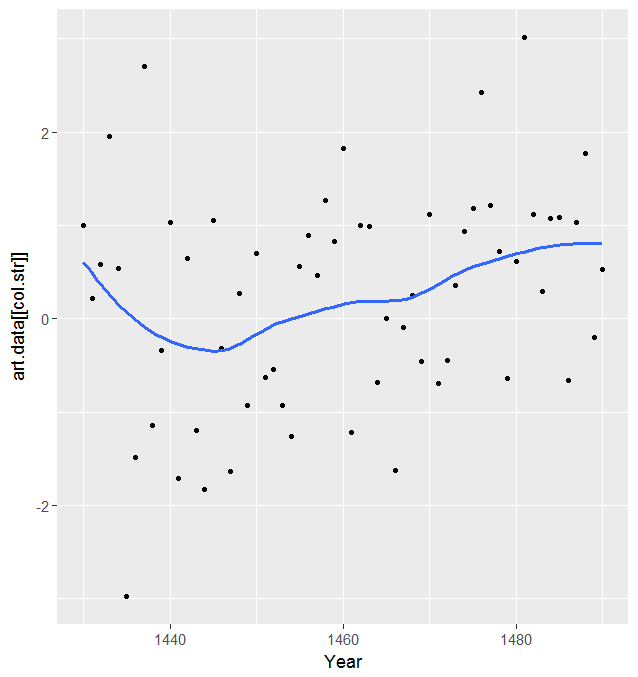
添加
group=1在 ggplot美学解决了这个问题:p <- ggplot(art.data, aes(x = year, y = art.data[[col.str]],
text=paste0(artist, "<br>", art), group=1)) +
geom_point(size = 1) +
stat_smooth(method = loess, se = FALSE) +
xlab("Year")
p
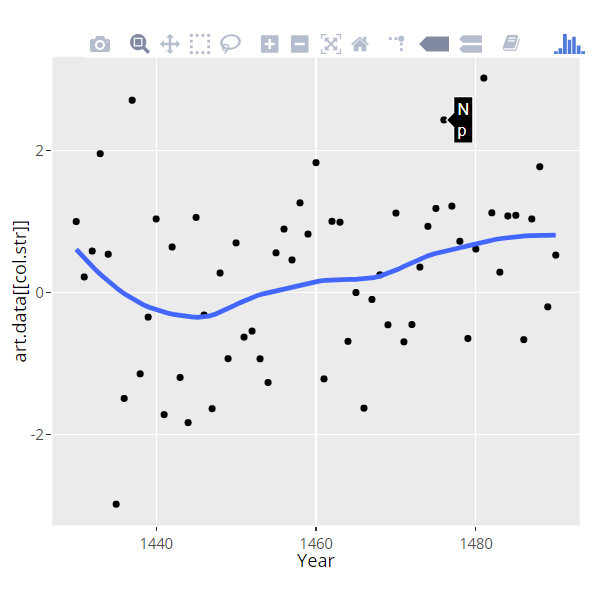
和
ggplotly现在效果很好:library(plotly)
ggplotly(p, tooltip="text")
关于r - 工具提示删除回归线 ggplotly,我们在Stack Overflow上找到一个类似的问题: https://stackoverflow.com/questions/47507186/