我想做的是玩弄一些随机分布。我不希望它是正常的。但暂时正常比较容易。
import matplotlib.pyplot as plt
from scipy.stats import norm
ws=norm.rvs(4.0, 1.5, size=100)
density, bins = np.histogram(ws, 50,normed=True, density=True)
unity_density = density / density.sum()
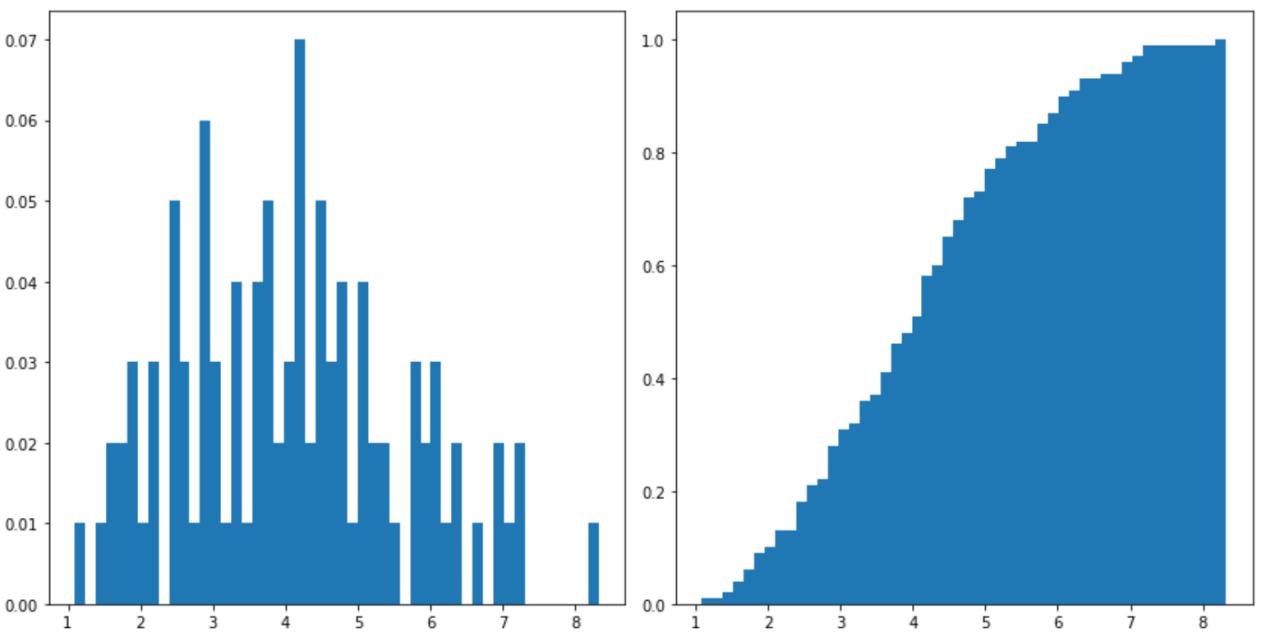
fig, ((ax1, ax2)) = plt.subplots(nrows=1, ncols=2, sharex=True, figsize=(12,6))
widths = bins[:-1] - bins[1:]
ax1.bar(bins[1:], unity_density, width=widths)
ax2.bar(bins[1:], unity_density.cumsum(), width=widths)
fig.tight_layout()
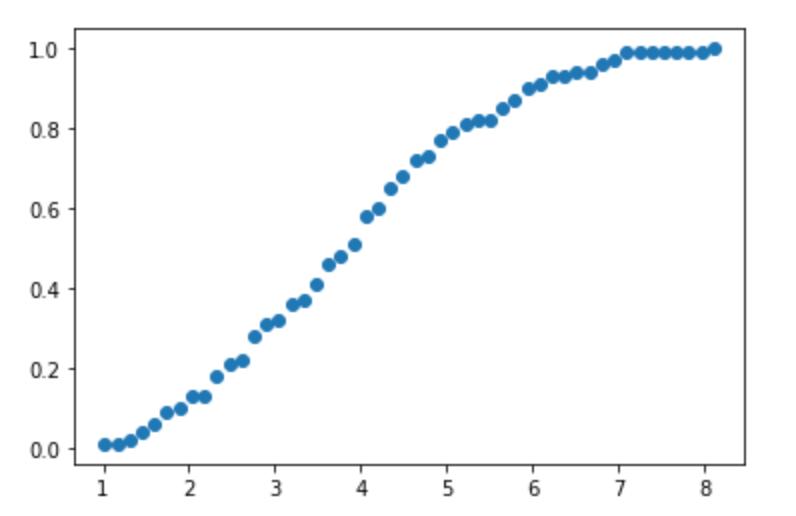
 然后我可以做的是根据点将 CDF 可视化。
density1=unity_density.cumsum()
x=bins[:-1]
y=density1

plt.plot(x, density1, 'o')
所以我一直在尝试做的是在 np.histogram 的输出上使用 np.interp 函数以获得表示 CDF 的平滑曲线并提取百分比点来绘制它们。理想情况下,我需要尝试手动完成所有操作并使用 scipy 中的 ppf 函数。 作为一名本科生,我一直在与统计学作斗争。我现在在读研究生,并尝试让我尽可能多地进行这样的练习,以便更深入地了解正在发生的事情。我已经对这项任务感到绝望了。 谢谢!
最佳答案
获得更平滑结果的一种可能性是使用更多样本,通过使用 10^5 个样本 和 100 个 bin 我得到以下图像:
ws = norm.rvs(loc=4.0, scale=1.5, size=100000)
density, bins = np.histogram(ws, bins=100, normed=True, density=True)


一般来说你可以使用scipys interpolation module平滑你的CDF。
对于 100 个样本 和平滑因子 s=0.01 我得到:
import numpy as np
import matplotlib.pyplot as plt
from scipy.interpolate import splev, splrep

density1 = unity_density.cumsum()
x = bins[:-1]
y = density1

# Interpolation
spl = splrep(x, y, s=0.01, per=False)
x2 = np.linspace(x[0], x[-1], 200)
y2 = splev(x2, spl)

# Plotting
fig, ax = plt.subplots()
plt.plot(x, density1, 'o')
plt.plot(x2, y2, 'r-')

第三种可能性是分析计算 CDF。如果您自己使用 numpy/scipy 函数生成噪声,大多数时候已经有可用的 CDF 实现,否则您应该在维基百科上找到它。如果您的样本来自测量结果,那当然是另一回事。
import numpy as np
from scipy.stats import norm
import matplotlib.pyplot as plt

fig, ax = plt.subplots()
x = np.linspace(-2, 10)
y = norm(loc=4.0, scale=1.5).cdf(x)
ax.plot(x, y, 'bo-')

关于python - 尝试在 Python 中插入直方图函数的输出,我们在Stack Overflow上找到一个类似的问题: https://stackoverflow.com/questions/60481471/