return {
  height: 210,
  title: title,
  autosize: true,
  width: '100%',
  font: {
    size: 10,
    family: "Roboto"
  },
  showlegend: false,
  margin: {
    l: 40,
    r: 10,
    b: 35,
    t: 22,
    pad: 0
  },
  xaxis: {
    nticks: 6,
    title: "Score",
    linecolor: '#cccccc',
    zerolinewidth: 0,
    zerolinecolor: '#fff'
  },
  yaxis: {
    title: "Number of students",
    linecolor: '#cccccc',
    zerolinewidth: 0,
    zerolinecolor: '#eeeeee',
    range: [0, numStudents]
  },
  bargap: 0.5
};
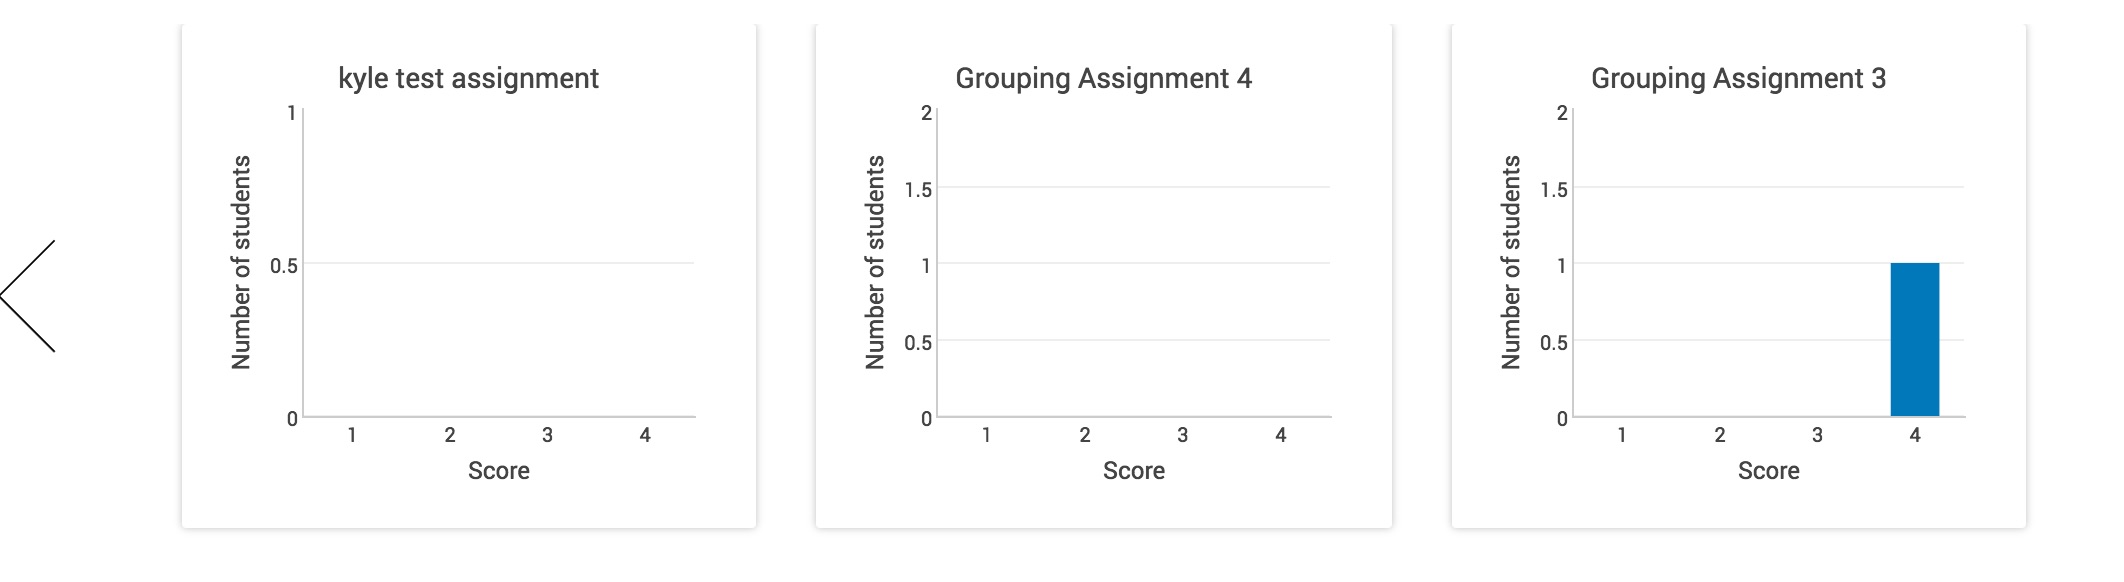
这包括半音以及1.5等等。我正在使用plotly.js,这就是我所看到的:
最佳答案
您可以通过设置 dtick 强制 Plotly 使用轴刻度之间的定义距离。在你的轴的 layout 选项中,即在你的情况下它是
{yaxis: {dtick: 1}}
请参阅下面的无 layout 设置与固定 dtick 设置的示例。
var trace1 = {
  x: ['A', 'B', 'C'],
  y: [1, 3, 2],
  mode: 'markers',
  type: 'bar'
};

Plotly.newPlot('myPlot1', [trace1], {yaxis: {dtick: 1}});
Plotly.newPlot('myPlot2', [trace1]);
<script src="https://cdn.plot.ly/plotly-latest.min.js">
</script>
<div id = "myPlot1" ></div>
<div id = "myPlot2" ></div>关于javascript - 如何删除plotly.js 图表轴中的非整数?,我们在Stack Overflow上找到一个类似的问题: https://stackoverflow.com/questions/46245740/