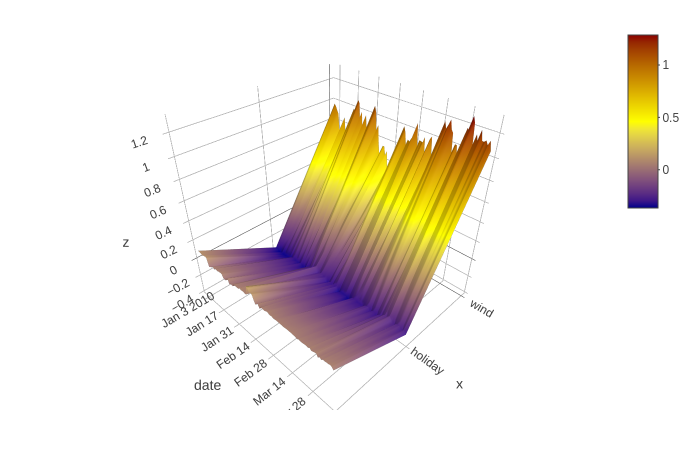
我有一个使用 plotly 的 3D 绘图,它可以呈现负值和正值。我想在点 0 添加透视 3D 平面(此处透视意味着设置 alpha = 0.3,如 ggplot2 中所示),以强调正/负值再来一点。或者,在背景中通过点 0 添加“网格”也会很有用。
代码:
library(plotly)
library(dplyr)
df %>%
  select(date, everything()) %>%
  plot_ly(
  x = colnames(subset(., select = c(2:4))),        # probably not the most efficient method
  y = ~date,
  z = data.matrix(subset(., select = c(2:4))),
  type = "surface",
  colors = c("darkblue", "yellow", "darkred")
)
数据:
df <- structure(list(wind = c(0.938535690307617, 0.976551234722137,
0.954551994800568, 0.920722126960754, 0.889751732349396, 0.701366603374481,
0.718878328800201, 0.685763895511627, 0.677822828292847, 0.876205325126648,
0.67054146528244, 0.738650739192963, 0.725420415401459, 0.851324200630188,
0.6589714884758, 0.880357265472412, 0.997677683830261, 0.968335390090942,
0.882899045944214, 1.09453165531158, 1.06842839717865, 0.819347560405731,
0.995919525623322, 0.695173263549805, 0.860199570655823, 0.977508246898651,
0.807886302471161, 0.778182446956635, 0.886279463768005, 0.879809498786926,
0.903579652309418, 1.09579062461853, 1.03768181800842, 0.802022874355316,
0.928451955318451, 0.744936227798462, 0.621560990810394, 0.706887602806091,
0.749234974384308, 0.746754884719849, 0.65381270647049, 0.710927248001099,
0.517793655395508, 0.477172255516052, 0.631662607192993, 0.55011123418808,
0.584086775779724, 0.617783904075623, 0.438043504953384, 0.577566087245941,
0.684398949146271, 1.00848543643951, 0.957233726978302, 0.84071296453476,
0.90149587392807, 0.888661623001099, 0.923080563545227, 0.945727407932281,
0.965020060539246, 1.07903909683228, 0.870955109596252, 0.934546709060669,
0.93314516544342, 0.926109850406647, 0.981102645397186, 0.770903468132019,
0.829349219799042, 0.980291783809662, 1.00809383392334, 0.821328639984131,
0.89130437374115, 0.886775732040405, 0.896964132785797, 1.08184945583344,
1.17395043373108, 1.11537420749664, 1.15379846096039, 1.20203125476837,
1.12583827972412, 1.10014677047729, 0.891100168228149, 1.01484513282776,
1.01270127296448, 0.895487844944, 0.877909421920776, 1.11780989170074,
1.18047833442688, 1.14531397819519, 1.28634309768677, 1.23702371120453,
1.01186645030975, 1.15563869476318, 1.0918824672699, 1.2023059129715,
1.11806273460388, 1.11690294742584, 1.13390302658081, 1.10064888000488,
1.1418149471283, 1.06309700012207), holiday = c(-0.323977619409561,
-0.32814821600914, -0.335260361433029, -0.355545252561569, -0.347469061613083,
-0.349574476480484, -0.331554502248764, -0.351303607225418, -0.342486947774887,
-0.34791961312294, -0.342795491218567, -0.344868391752243, -0.344075173139572,
-0.342763870954514, -0.365125387907028, -0.301046937704086, -0.303365021944046,
-0.301353365182877, -0.316689401865005, -0.312132269144058, -0.317412197589874,
-0.331865310668945, -0.306569844484329, -0.306523144245148, -0.328399240970612,
-0.328934848308563, -0.340233236551285, -0.310919582843781, -0.352815061807632,
-0.324335247278214, -0.333071410655975, -0.25605234503746, -0.28141376376152,
-0.267955660820007, -0.261935144662857, -0.23365119099617, -0.204256281256676,
-0.271868377923965, -0.266900211572647, -0.268673747777939, -0.246791422367096,
-0.261210560798645, -0.275096118450165, -0.272033154964447, -0.307673662900925,
-0.316463977098465, -0.315838783979416, -0.278884381055832, -0.29575651884079,
-0.300951153039932, -0.275152236223221, -0.292507320642471, -0.283683449029922,
-0.333169460296631, -0.323910266160965, -0.317758291959763, -0.318425863981247,
-0.318803340196609, -0.316879868507385, -0.321441829204559, -0.342198520898819,
-0.336640536785126, -0.334549427032471, -0.304668426513672, -0.281678169965744,
-0.287939876317978, -0.278673946857452, -0.299236595630646, -0.295697629451752,
-0.297617554664612, -0.300621718168259, -0.294943511486053, -0.291149199008942,
-0.263380706310272, -0.264828890562057, -0.260132044553757, -0.294039487838745,
-0.284087061882019, -0.27564924955368, -0.275646597146988, -0.294898957014084,
-0.290615618228912, -0.264040410518646, -0.267250239849091, -0.27454400062561,
-0.22650308907032, -0.220207497477531, -0.233633011579514, -0.205283910036087,
-0.201104089617729, -0.235431581735611, -0.252072185277939, -0.257701843976974,
-0.233586445450783, -0.239779070019722, -0.233227252960205, -0.26639312505722,
-0.256356805562973, -0.248022571206093, -0.285306513309479),
    month_10 = c(0.109010718762875, 0.112969301640987, 0.110368527472019,
    0.107052445411682, 0.0947703272104263, 0.109930463135242,
    0.106371931731701, 0.114236004650593, 0.102411419153214,
    0.0184143912047148, 0.0301767271012068, 0.0376978516578674,
    0.0472327470779419, 0.0622735135257244, 0.043902475386858,
    0.0611664243042469, 0.0618763938546181, 0.0555795393884182,
    0.0623081848025322, 0.0636096075177193, 0.0675770491361618,
    0.0629641935229301, 0.0288578178733587, 0.025121470913291,
    0.0300221722573042, 0.0611664243042469, 0.0659252777695656,
    0.0159557648003101, 0.0376978516578674, 0.032174538820982,
    0.0317839048802853, 0.0626140907406807, 0.0577763170003891,
    0.0571180321276188, 0.0571180321276188, 0.0590739175677299,
    0.0760120898485184, 0.0670360922813416, 0.0699110627174377,
    0.0717969089746475, 0.0640148967504501, 0.0670360922813416,
    0.164964601397514, 0.152724280953407, 0.115071900188923,
    0.129654854536057, 0.122471310198307, 0.0768138542771339,
    0.0400041155517101, 0.0573667995631695, 0.0685276389122009,
    0.0337212830781937, 0.0616994015872478, 0.0589617975056171,
    0.059433214366436, 0.0567467175424099, 0.0661386772990227,
    0.0704409778118134, 0.0611028559505939, 0.0579087659716606,
    0.0622764676809311, 0.0538184903562069, 0.0553129874169827,
    0.058912742882967, 0.059433214366436, 0.0575473643839359,
    0.0575473643839359, 0.058104183524847, 0.055678017437458,
    0.0575473643839359, 0.059433214366436, 0.0603105537593365,
    0.0589617975056171, 0.0601625964045525, 0.0577935017645359,
    0.0574705749750137, 0.0550192892551422, 0.0475285314023495,
    0.0577935017645359, 0.0543489865958691, 0.0526755712926388,
    0.0553129874169827, 0.0589617975056171, 0.0593133755028248,
    0.0547068528831005, 0.0676216259598732, 0.0511428378522396,
    0.0564789660274982, 0.0641900449991226, 0.0666491389274597,
    0.0390096306800842, 0.058005329221487, 0.0449355207383633,
    0.062143836170435, 0.0591179206967354, 0.0637796893715858,
    0.0633300691843033, 0.0702810436487198, 0.0647093132138252,
    0.0427459664642811), month_12 = c(0.0733551606535912, 0.0707022771239281,
    0.0707631036639214, 0.0718683376908302, 0.071540854871273,
    0.0993443354964256, 0.0973133370280266, 0.0668289735913277,
    0.0731536969542503, 0.0717423185706139, 0.0750747397542,
    0.0754749700427055, 0.0746353641152382, 0.0912141725420952,
    0.100288398563862, 0.07671108096838, 0.0708827450871468,
    0.0708827450871468, 0.0741974636912346, 0.0761196836829185,
    0.0648202076554298, 0.114817388355732, 0.100519739091396,
    0.100288398563862, 0.102664910256863, 0.0566539540886879,
    0.0648743882775307, 0.0706770494580269, 0.0746353641152382,
    0.0750747397542, 0.0750747397542, 0.113439425826073, 0.127338454127312,
    0.114467553794384, 0.112322382628918, 0.136203452944756,
    0.131634846329689, 0.144591823220253, 0.139709115028381,
    0.140504062175751, 0.145617410540581, 0.166768744587898,
    0.151759415864944, 0.151587069034576, 0.156320676207542,
    0.131974145770073, 0.135847419500351, 0.159762278199196,
    0.163790658116341, 0.158604919910431, 0.127949997782707,
    0.109744042158127, 0.101787634193897, 0.0582009926438332,
    0.0671374276280403, 0.0669510439038277, 0.074992410838604,
    0.074992410838604, 0.0787725821137428, 0.0696783438324928,
    0.0965322777628899, 0.0666131302714348, 0.0666131302714348,
    0.0925824269652367, 0.0875711515545845, 0.0873847678303719,
    0.0873847678303719, 0.0711322501301765, 0.0696783438324928,
    0.0667495802044868, 0.0667495802044868, 0.0685289725661278,
    0.0582009926438332, 0.0599979534745216, 0.0702869072556496,
    0.068938173353672, 0.0610831864178181, 0.074992410838604,
    0.0702869072556496, 0.0683296099305153, 0.0671374276280403,
    0.0666131302714348, 0.0815844461321831, 0.070037417113781,
    0.068938173353672, 0.0862899348139763, 0.0824234709143639,
    0.0761196836829185, 0.0663527771830559, 0.0751885995268822,
    0.072908379137516, 0.0599117167294025, 0.0743952021002769,
    0.0666681602597237, 0.0667495802044868, 0.0748060271143913,
    0.0800538137555122, 0.0787725821137428, 0.0741974636912346,
    0.0741937384009361), date = structure(c(14610, 14611, 14612,
    14613, 14614, 14615, 14616, 14617, 14618, 14619, 14620, 14621,
    14622, 14623, 14624, 14625, 14626, 14627, 14628, 14629, 14630,
    14631, 14632, 14633, 14634, 14635, 14636, 14637, 14638, 14639,
    14640, 14641, 14642, 14643, 14644, 14645, 14646, 14647, 14648,
    14649, 14650, 14651, 14652, 14653, 14654, 14655, 14656, 14657,
    14658, 14659, 14660, 14661, 14662, 14663, 14664, 14665, 14666,
    14667, 14668, 14669, 14670, 14671, 14672, 14673, 14674, 14675,
    14676, 14677, 14678, 14679, 14680, 14681, 14682, 14683, 14684,
    14685, 14686, 14687, 14688, 14689, 14690, 14691, 14692, 14693,
    14694, 14695, 14696, 14697, 14698, 14699, 14700, 14701, 14702,
    14703, 14704, 14705, 14706, 14707, 14708, 14709), class = "Date")), row.names = c(NA,
100L), class = "data.frame")
最佳答案
在 z 值为 0 处添加一个平面:
library(plotly)
library(dplyr)

# I separated your df wrangling to better understand the data
df <- df %>%
  select(date, everything())

# Code you posted
df %>%
  plot_ly(
    x = colnames(subset(., select = c(2:4))),        # probably not the most efficient method
    y = ~date,
    z = data.matrix(subset(., select = c(2:4))),
    type = "surface",
    colors = c("darkblue", "yellow", "darkred")
  ) %>%

# The surface added by using y & x from df
#  and making z a matrix of zeros 3 rows by 100 columns.
  add_surface(z = matrix(0, ncol = 3, nrow = 100),
              y = df$date,
              x = colnames(subset(df, select = c(2:4))),
              opacity = .8)
你的 plotly :
添加零 z 平面:

关于r - 在绘图中的点 0 处添加 3d 曲面,我们在Stack Overflow上找到一个类似的问题: https://stackoverflow.com/questions/59595018/