我有一个 2D 矩阵 Main、一个高度与 Main 高度匹配的 Left 矩阵和一个 Top > 宽度与Main 宽度匹配的矩阵。我希望所有 3 个图像都有颜色条(受各自限制的限制),并将它们拼接成 1 个图像,Top 到顶部,Left 到左侧主要。
最后,我希望能够在其他图的子图中绘制整个 block 。
到目前为止,我一直在尝试axes_grid1,但我无法让细矩阵(和颜色条)粘在适当的一侧。我应该完全使用其他东西吗?
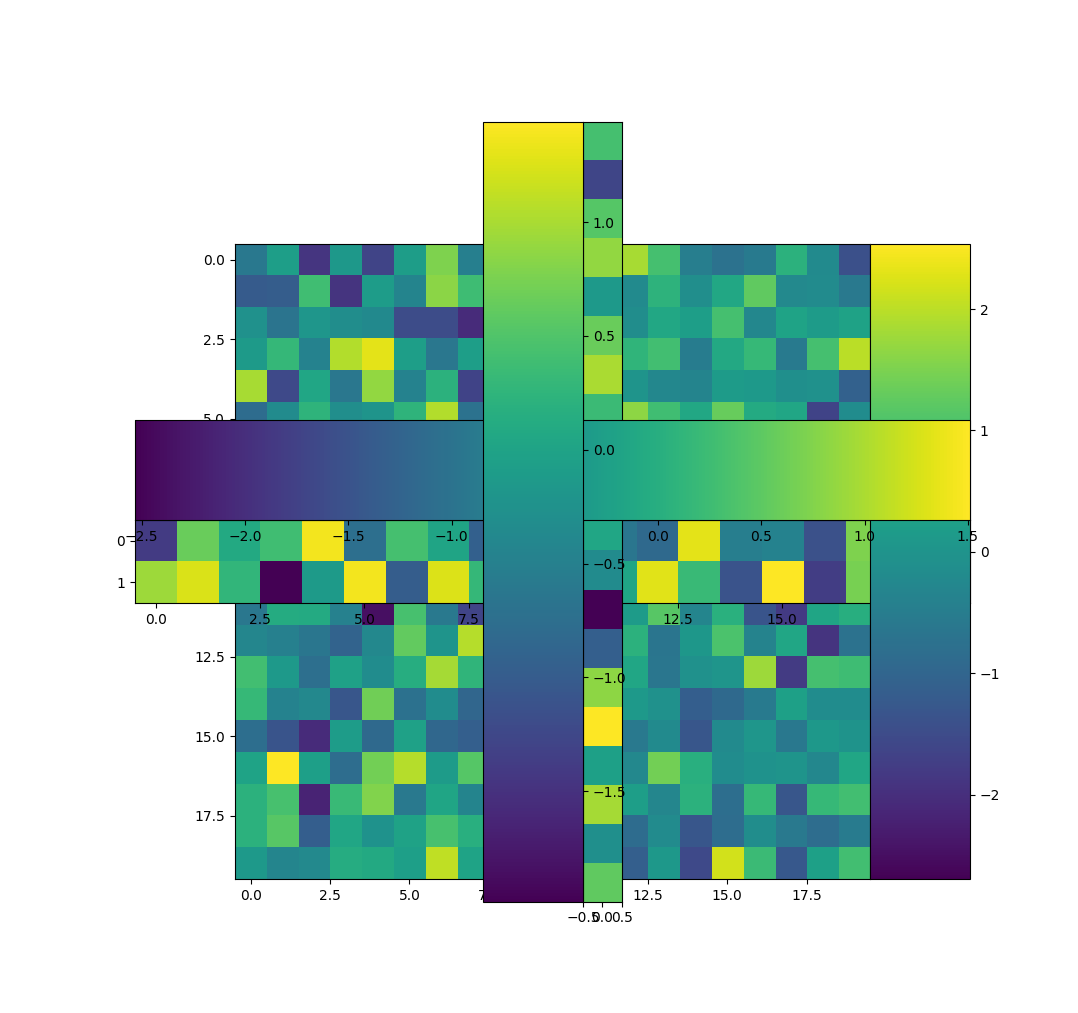
import numpy as np
import matplotlib.pyplot as plt
from mpl_toolkits.axes_grid1 import make_axes_locatable

# Data
n = 20
Main = np.random.randn(n, n)
Left = np.random.randn(n, 1)
Top  = np.random.randn(n, 2)

# Setup
fig, ax = plt.subplots()
divider = make_axes_locatable(ax)
ax_top   = divider.append_axes("top",   1., pad=0.)
ax_left  = divider.append_axes("left",  1., pad=0.)
ax_right = divider.append_axes("right", 1., pad=0.)

# Main
im_main = ax.imshow(Main)
clrbar_right = plt.colorbar(im_main, cax=ax_right)

# Top
im_top  = ax_top.imshow(Top.T)
ax_top_divider = make_axes_locatable(ax_top)
ax_top_top = ax_top_divider.append_axes('top', 1., pad=0.)
ax_top_clrbar = plt.colorbar(im_top, cax=ax_top_top, orientation='horizontal')

# Left
im_left = ax_left.imshow(Left)
ax_left_divider = make_axes_locatable(ax_left)
ax_left_left = ax_left_divider.append_axes('left', 1., pad=0.)
ax_left_clrbar = plt.colorbar(im_left, cax=ax_left_left)
plt.show()
最佳答案
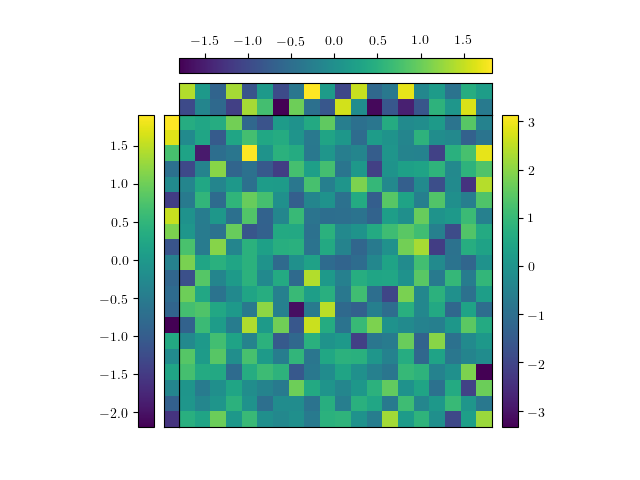
我认为您几乎已经正确了,但无需创建多个分隔线来附加颜色条轴。我们可以使用原来的分隔线本身。我必须使用 append_axes 的 size 参数来获得与下面的代码正确的间距。关于将整个 block 添加到另一个情节的子情节中,这可能会带来更多我尚未检查的挑战。
import numpy as np
import matplotlib.pyplot as plt
from mpl_toolkits.axes_grid1 import make_axes_locatable

# Data
n = 20

Main = np.random.randn(n, n)
Left = np.random.randn(n, 1)
Top  = np.random.randn(n, 2)

# Setup
fig, ax = plt.subplots()
divider = make_axes_locatable(ax)

# The top and left axes for images
ax_top = divider.append_axes('top',size='10%',pad=0.0)
ax_left = divider.append_axes('left',size='5%', pad=0.)

# The color bar axes
ax_top_top  = divider.append_axes('top', size='5%',pad=0.1)
ax_left_left = divider.append_axes('left',size='5%', pad=0.1)
ax_right = divider.append_axes('right',size='5%', pad=0.1)


# Main
im_main = ax.imshow(Main)
clrbar_right = plt.colorbar(im_main, cax=ax_right)

# Top
im_top  = ax_top.imshow(Top.T)
ax_top_clrbar = plt.colorbar(im_top, cax=ax_top_top, orientation='horizontal')

# Left
im_left = ax_left.imshow(Left)
ax_left_clrbar = plt.colorbar(im_left, cax=ax_left_left)

# Turn off the axis labels for the images if you like
ax.axes.get_xaxis().set_visible(False)
ax.axes.get_yaxis().set_visible(False)
ax_top.axes.get_xaxis().set_visible(False)
ax_top.axes.get_yaxis().set_visible(False)
ax_left.axes.get_xaxis().set_visible(False)
ax_left.axes.get_yaxis().set_visible(False)

# Switch the ticks for the color bars on the left and the top
ax_left_left.yaxis.tick_left()
ax_top_top.xaxis.tick_top()

plt.show()
关于python - 在Python的Matplotlib中,如何让薄图像与主图像边框?,我们在Stack Overflow上找到一个类似的问题: https://stackoverflow.com/questions/50627658/