我有一个热图:
fig =figsize(8,8)
ax = sbn.heatmap(good,annot=True, fmt='.2f', linewidths=.3, annot_kws={"size": 14},square=True,robust=True,cmap=sbn.light_palette((210, 90, 60), input="husl") )
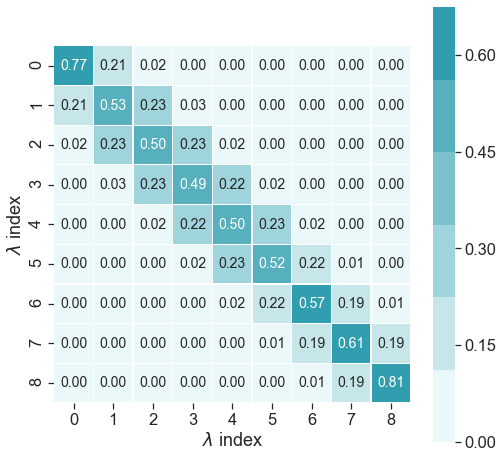
seaborn 热图可以方便地设置我的注释的颜色。我想访问 annot_kws 字典,但我不知道该怎么做。我本质上想在不同的绘图中重用 seaborn 自动生成的颜色。
更清晰的例子:
test = np.array([np.array([0.77,0.21]),np.array([0.21,0.51])])
ax = sbn.heatmap(test,annot=True, fmt='.2f',  annot_kws={"size": 14},cmap=sbn.light_palette((210, 90, 60), input="husl") )
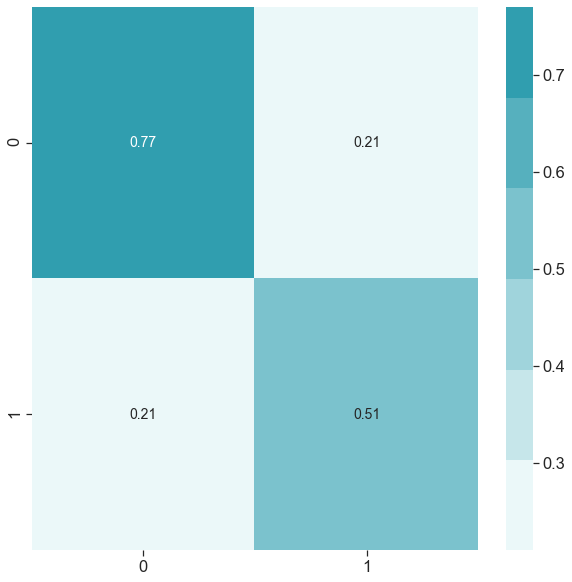
我可以将默认注释的颜色更改为全部单一颜色
test = np.array([np.array([0.77,0.21]),np.array([0.21,0.51])])
ax = sbn.heatmap(test,annot=True, fmt='.2f',  annot_kws={"size": 14, "color":'black'},cmap=sbn.light_palette((210, 90, 60), input="husl") )
这给了我this picture
我想将信息传递到热图,也就是说让我将所有白色注释更改为黄色,但将黑色注释保留为黑色。我想如果我可以获得有关当前注释颜色的信息,我可以根据它是黑色还是白色不同颜色来更新它们,但不知道如何实际获取该信息。
最佳答案
编辑:我第一次误读了你的问题。我认为经过编辑的答案满足了您的要求。
您可以通过subplots.get_children()访问注释(即Text对象)
代码:
import matplotlib.pyplot as plt
import numpy as np
import pandas as pd
import seaborn as sns
from matplotlib.text import Text

# default colormap example
df = pd.DataFrame(np.random.normal(size=(5, 5)))
subplots = sns.heatmap(df.corr(), annot=True, annot_kws={"size": 14, "color": "black"})

# the first 5 * 5 Text objects in text_objs are the matrix annotations
# the few at the end are default annotations (title text I think) and are not
#   formatted according to to annot_kws; ignore these
text_objs = list(filter(lambda x: isinstance(x, Text), subplots.get_children()))
print(len(text_objs))
# first Text object
print(text_objs[0].get_size())
print(text_objs[0].get_color())
# last Text object
print(text_objs[-1].get_size())
print(text_objs[-1].get_color())
输出:
28
14.0
'black'
12.0
'black' # this is a coincidence
关于python - 从图中获取热图注释字典,我们在Stack Overflow上找到一个类似的问题: https://stackoverflow.com/questions/57255057/