我有使用图像注释的图:
def add_image(axe, filename, position, zoom):
    img = plt.imread(filename)
    off_img = matplotlib.offsetbox.OffsetImage(img, zoom = zoom, resample = False)
    art = matplotlib.offsetbox.AnnotationBbox(off_img, position, xybox = (0, 0),
        xycoords = axe.transAxes, boxcoords = "offset points", frameon = False)
    axe.add_artist(art)
然后我将图形保存到某个 pdf 文件中,例如 fig.pdf。我希望将准确的原始图像嵌入到生成的 pdf 中,而无需重新采样。但是,图像会根据 savefig() 的 dpi 参数重新采样。
如何强制 matplotlib 不重新采样图像(无论如何对于矢量输出这样做是没有意义的)?
有关更多详细信息,这是一个简单的示例,使用 this image作为image.png:
import numpy as np
import matplotlib
matplotlib.use("agg")
import matplotlib.pyplot as plt

def add_image(axe, filename, position, zoom):
    img = plt.imread(filename)
    off_img = matplotlib.offsetbox.OffsetImage(img, zoom = zoom, resample = False)
    art = matplotlib.offsetbox.AnnotationBbox(off_img, position, xybox = (0, 0),
        xycoords = axe.transAxes, boxcoords = "offset points", frameon = False)
    axe.add_artist(art)

# ==========
fig = plt.figure()
axe = plt.axes()
fig.set_size_inches(3, 1.5)
axe.plot(np.arange(10), np.arange(10))

add_image(axe, "image.png", position = (0.2, 0.7), zoom = 0.07)

fig.savefig("temp.pdf", bbox_inches = "tight", pad_inches = 0)
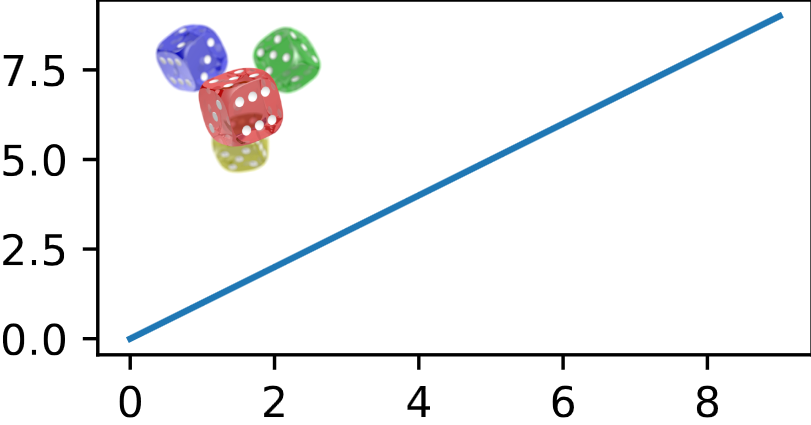
预期结果:
实际结果:

最佳答案
只是 https://github.com/matplotlib/matplotlib/issues/16268 中讨论的快速总结:
在不重新采样的情况下传递图像确实是一个理想的功能,主要是因为对于矢量输出,它实际上应该由渲染器(例如 pdf 查看器、打印机等)来确定分辨率。
事实上,matplotlib 目前不允许这样做,这主要是一个疏忽。
解决方案(快速破解)是在生成图形之前添加以下代码:
from matplotlib.backends.backend_mixed import MixedModeRenderer

def _check_unsampled_image(self, renderer):
    if isinstance(renderer, MixedModeRenderer):
        return True
    else:
        return False

matplotlib.image.BboxImage._check_unsampled_image = _check_unsampled_image
但这并不意味着在生产代码中使用,并且需要在未来的 matplotlib 版本中实现更强大的解决方案。欢迎贡献。
关于python - 保存为 pdf 时保留原始图像数据,我们在Stack Overflow上找到一个类似的问题: https://stackoverflow.com/questions/59813441/