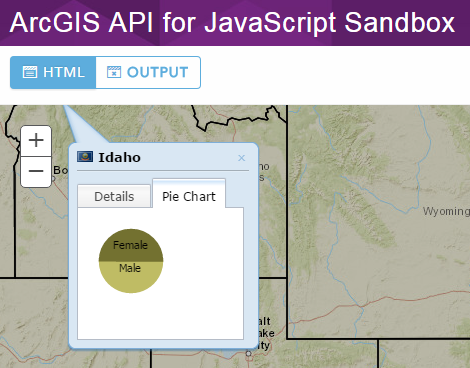
我正在使用这个 Info window with chart ESRI 教程。

我想为较小的屏幕定制 dojox 饼图:
@media only screen
  and (max-device-width: 320px) {
    ...
  }
是否可以为自定义屏幕尺寸使用自定义 dojox 图表尺寸?
例如饼图为{width: 60px; height: 60px} 仅当在 max-device-width: 320px 的屏幕上加载时?
最佳答案
是的,这是可能的。
不过恐怕你不能仅通过 CSS 实现这一点,因为图表的大小取决于各种因素。如图表半径, map 信息窗口大小,容器大小<等
解决方案-
您可以根据屏幕大小动态更改上述值,您可以为此使用 window resize event..这就是您实现此目的的方法。
下面是工作代码-
<!DOCTYPE html>
<html>
  <head>
    <meta http-equiv="Content-Type" content="text/html; charset=utf-8">

    <meta name="viewport" content="initial-scale=1, maximum-scale=1,user-scalable=no">
    <title>Info Window with Chart</title>
    <link rel="stylesheet" href="https://js.arcgis.com/3.20/dijit/themes/claro/claro.css">
    <link rel="stylesheet" href="https://js.arcgis.com/3.20/esri/css/esri.css">
    <style>
      html, body, #map {
        height: 100%;
        width: 100%;
        margin: 0;
        padding: 0;
      }
      .chart {
        width:100px;
        height:100px;
        padding:0px !important;
      }
    </style>
    <script src="https://js.arcgis.com/3.20/"></script>
    <script>
      var map;
      // Try other themes: Julie, CubanShirts, PrimaryColors, Charged, BlueDusk, Bahamation, Harmony, Shrooms
      var theme = "Wetland";
      require([
        "esri/map", "esri/layers/FeatureLayer",
        "esri/dijit/InfoWindow", "esri/InfoTemplate",
        "esri/symbols/SimpleFillSymbol", "esri/renderers/SimpleRenderer",
        "dijit/layout/ContentPane", "dijit/layout/TabContainer",
        "dojox/charting/Chart2D", "dojox/charting/plot2d/Pie",
        "dojox/charting/action2d/Highlight", "dojox/charting/action2d/MoveSlice", "dojox/charting/action2d/Tooltip",
        "dojox/charting/themes/" + theme,
        "dojo/dom-construct", "dojo/dom-class",
        "dojo/number", "dojo/domReady!"
      ], function(
        Map, FeatureLayer,
        InfoWindow, InfoTemplate,
        SimpleFillSymbol, SimpleRenderer,
        ContentPane, TabContainer,
        Chart2D, Pie,
        Highlight, MoveSlice, Tooltip,
        dojoxTheme,
        domConstruct, domClass,
        number, parser
      ) {
        // Use the info window instead of the popup.
        var infoWindow = new InfoWindow(null, domConstruct.create("div"));
        infoWindow.startup();

        map = new Map("map", {
          basemap: "streets",
          center: [-113.405, 43.521],
          infoWindow: infoWindow,
          zoom: 6
        });
        map.infoWindow.resize(180, 200);

        var template = new esri.InfoTemplate();
        // Flag icons are from http://twitter.com/thefella, released under creative commons.
        template.setTitle("<b><img src='flags/${STATE_ABBR}.png'>  ${STATE_NAME}</b>");
        template.setContent(getWindowContent);

        var statesLayer = new FeatureLayer("https://sampleserver1.arcgisonline.com/ArcGIS/rest/services/Demographics/ESRI_Census_USA/MapServer/5", {
          mode: FeatureLayer.MODE_ONDEMAND,
          infoTemplate: template,
          outFields: ["*"]
        });
        var symbol = new SimpleFillSymbol();
        statesLayer.setRenderer(new SimpleRenderer(symbol));

        map.addLayer(statesLayer);

        function getWindowContent(graphic) {
          // Make a tab container.
          var tc = new TabContainer({
            style: "width:100%;height:100%;"
          }, domConstruct.create("div"));

          // Display attribute information.
          var cp1 = new ContentPane({
            title: "Details",
            content: "<a target='_blank' href='https://en.wikipedia.org/wiki/" +
              graphic.attributes.STATE_NAME + "'>Wikipedia Entry</a><br><br>Median Age: " +
              graphic.attributes.MED_AGE + "<br>Median Age (Male): " +
              graphic.attributes.MED_AGE_M + "<br>Median Age (Female): " +
              graphic.attributes.MED_AGE_F
          });
          // Display a dojo pie chart for the male/female percentage.
          var cp2 = new ContentPane({
            title: "Pie Chart"
          });
          tc.addChild(cp1);
          tc.addChild(cp2);

          // Create the chart that will display in the second tab.
          var c = domConstruct.create("div", {
            id: "demoChart"
          }, domConstruct.create("div"));
          var chart = new Chart2D(c);
          domClass.add(chart, "chart");

          // Apply a color theme to the chart.
          chart.setTheme(dojoxTheme);
          chart.addPlot("default", {
            type: "Pie",
            radius: 45,
            htmlLabels: true
          });
          tc.watch("selectedChildWidget", function(name, oldVal, newVal){
            if ( newVal.title === "Pie Chart" ) {
              chart.resize(100,100);
            }
          });

          // Calculate percent male/female.
          var total = graphic.attributes.POP2000;
          var male = number.round(graphic.attributes.MALES / total * 100, 2);
          var female = number.round(graphic.attributes.FEMALES / total * 100, 2);
          chart.addSeries("PopulationSplit", [{
            y: male,
            tooltip: male,
            text: "Male"
          }, {
            y: female,
            tooltip: female,
            text: "Female"
          }]);
          //highlight the chart and display tooltips when you mouse over a slice.
          new Highlight(chart, "default");
          new Tooltip(chart, "default");
          new MoveSlice(chart, "default");

          cp2.set("content", chart.node);
          return tc.domNode;
        }
      });
    </script>
  </head>

  <body class="claro">
    <div id="map"></div>
  </body>
</html>
希望这对您有所帮助:)
关于javascript - 在移动屏幕上调整 dojox 图表的大小,我们在Stack Overflow上找到一个类似的问题: https://stackoverflow.com/questions/43965160/