我正在尝试绘制 2 个单位向量,然后在它们之间绘制一条弧线。我不是在寻找任何解决方案,而是想知道为什么我的特定解决方案不起作用。
首先,我随机选择 2 个单位向量。
function rand(min, max) {
  if (max === undefined) {
    max = min;
    min = 0;
  }
  return Math.random() * (max - min) + min;
}

var points = [{},{}];

points[0].direction = normalize([rand(-1, 1), rand(-1, 1), 0]);
points[1].direction = normalize([rand(-1, 1), rand(-1, 1), 0]);
注意:这里的数学是 3D 的,但我通过将向量保持在 XY 平面中来使用 2d 示例
我可以在 Canvas 中绘制这 2 个单位向量
  // move to center of canvas
  var scale = ctx.canvas.width / 2 * 0.9;
  ctx.transform(ctx.canvas.width / 2, ctx.canvas.height / 2);
  ctx.scale(scale, scale);  // expand the unit fill the canvas

  // draw a line for each unit vector
  points.forEach(function(point) {
    ctx.beginPath();
    ctx.moveTo(0, 0);
    ctx.lineTo(point.direction[0], point.direction[1]);
    ctx.strokeStyle = point.color;
    ctx.stroke();
  });
有效。
接下来我想制作一个矩阵,将 XY 平面的 Y 轴与第一个单位向量对齐,并与 2 个单位向量所描述的平面处于同一平面
  var zAxis = normalize(cross(points[0].direction, points[1].direction));
  var xAxis = normalize(cross(zAxis, points[0].direction));
  var yAxis = points[0].direction;
然后我使用该矩阵绘制一个单位网格
ctx.setTransform(
    xAxis[0] * scale, xAxis[1] * scale,
    yAxis[0] * scale, yAxis[1] * scale,
    ctx.canvas.width / 2, ctx.canvas.height / 2);

ctx.beginPath();
for (var y = 0; y < 20; ++y) {
  var v0 = (y + 0) / 20;
  var v1 = (y + 1) / 20;
  for (var x = 0; x < 20; ++x) {
    var u0 = (x + 0) / 20;
    var u1 = (x + 1) / 20;
    ctx.moveTo(u0, v0);
    ctx.lineTo(u1, v0);
    ctx.moveTo(u0, v0);
    ctx.lineTo(u0, v1);
  }
}
ctx.stroke();
这也行。运行下面的示例,可以看到粉红色单位网格始终与绿色单位向量对齐并面向红色单位向量的方向。
最后使用单位网格的数据,我想将其弯曲正确的量以填充 2 个单位向量之间的空间。鉴于它是一个单位网格,我似乎应该能够做到这一点
var cosineOfAngleBetween = dot(points[0].direction, points[1].direction);
var expand = (1 + -cosineOfAngleBetween) / 2 * Math.PI;
var angle = x * expand;      // x goes from 0 to 1
var newX = sin(angle) * y;   // y goes from 0 to 1
var newY = cos(angle) * y;
如果我为每个网格点绘制 newX 和 newY,我似乎应该得到 2 个单位向量之间的正确弧线。
取两个单位向量的点积应该得到它们之间夹 Angular 的余弦值,如果它们重合,则从1到-1,如果它们重合对面的。在我的例子中,我需要 expand 从 0 到 PI 所以 (1 + -dot(p0, p1))/2 * PI 似乎应该可以工作。
但事实并非如此。请看蓝色圆弧,它是上面代码的输入单位网格点。
我检查了一些东西。我检查过 zAxis 是否正确。它总是 [0,0,1] 或 [0,0,-1] 是正确的。我检查了 xAxis 和 yAxis 是单位向量。他们是。我检查了将 expand 手动设置为 PI * .5、PI、PI * 2,它完全符合我的要求预计。 PI * .5 得到一个 90 度的弧,从蓝色单位向量开始的 1/4 处。 PI 完全符合我的预期得到一个半圆。 PI * 2 得到一个完整的圆。
这使得 dot(p0,p1) 看起来是错误的,但查看 dot 函数似乎是正确的,如果用各种简单的向量测试它,它会返回什么我希望 dot([1,0,0], [1,0,0]) 返回 1。dot([-1,0,0],[1,0,0 ]) 返回 -1。 dot([1,0,0],[0,1,0]) 返回 0。dot([1,0,0],normalize([1,1,0] )) 返回 0.707...
我错过了什么?
下面是代码
function cross(a, b) {
  var dst = []

  dst[0] = a[1] * b[2] - a[2] * b[1];
  dst[1] = a[2] * b[0] - a[0] * b[2];
  dst[2] = a[0] * b[1] - a[1] * b[0];

  return dst;
}

function normalize(a) {
  var dst = [];

  var lenSq = a[0] * a[0] + a[1] * a[1] + a[2] * a[2];
  var len = Math.sqrt(lenSq);
  if (len > 0.00001) {
    dst[0] = a[0] / len;
    dst[1] = a[1] / len;
    dst[2] = a[2] / len;
  } else {
    dst[0] = 0;
    dst[1] = 0;
    dst[2] = 0;
  }

  return dst;
}

function dot(a, b) {
 return (a[0] * b[0]) + (a[1] * b[1]) + (a[2] * b[2]);
}

var canvas = document.querySelector("canvas");
canvas.width = 200;
canvas.height = 200;
var ctx = canvas.getContext("2d");

function rand(min, max) {
  if (max === undefined) {
    max = min;
    min = 0;
  }
  return Math.random() * (max - min) + min;
}

var points = [
  {
    direction: [0,0,0],
    color: "green",
  },
  {
    direction: [0,0,0],
    color: "red",
  },
];

var expand = 1;
var scale = ctx.canvas.width / 2 * 0.8;

function pickPoints() {
  points[0].direction = normalize([rand(-1, 1), rand(-1, 1), 0]);
  points[1].direction = normalize([rand(-1, 1), rand(-1, 1), 0]);
  expand = (1 + -dot(points[0].direction, points[1].direction)) / 2 * Math.PI;
  console.log("expand:", expand);

  render();
}
pickPoints();

function render() {
  ctx.clearRect(0, 0, ctx.canvas.width, ctx.canvas.height);
  ctx.save();
  ctx.translate(ctx.canvas.width / 2, ctx.canvas.height / 2);
  ctx.scale(scale, scale);

  ctx.lineWidth = 3 / scale;
  points.forEach(function(point) {
    ctx.beginPath();
    ctx.moveTo(0, 0);
    ctx.lineTo(point.direction[0], point.direction[1]);
    ctx.strokeStyle = point.color;
    ctx.stroke();
  });

  var zAxis = normalize(cross(points[0].direction, points[1].direction));
  var xAxis = normalize(cross(zAxis, points[0].direction));
  var yAxis = points[0].direction;

  ctx.setTransform(
      xAxis[0] * scale, xAxis[1] * scale,
      yAxis[0] * scale, yAxis[1] * scale,
      ctx.canvas.width / 2, ctx.canvas.height / 2);

  ctx.lineWidth = 0.5 / scale;

  ctx.strokeStyle = "pink";
  drawPatch(false);
  ctx.strokeStyle = "blue";
  drawPatch(true);

  function drawPatch(curved) {
    ctx.beginPath();
    for (var y = 0; y < 20; ++y) {
      var v0 = (y + 0) / 20;
      var v1 = (y + 1) / 20;
      for (var x = 0; x < 20; ++x) {
        var u0 = (x + 0) / 20;
        var u1 = (x + 1) / 20;
        if (curved) {
          var a0 = u0 * expand;
          var x0 = Math.sin(a0) * v0;
          var y0 = Math.cos(a0) * v0;
          var a1 = u1 * expand;
          var x1 = Math.sin(a1) * v0;
          var y1 = Math.cos(a1) * v0;
          var a2 = u0 * expand;
          var x2 = Math.sin(a0) * v1;
          var y2 = Math.cos(a0) * v1;
          ctx.moveTo(x0, y0);
          ctx.lineTo(x1, y1);
          ctx.moveTo(x0, y0);
          ctx.lineTo(x2, y2);
        } else {
          ctx.moveTo(u0, v0);
          ctx.lineTo(u1, v0);
          ctx.moveTo(u0, v0);
          ctx.lineTo(u0, v1);
        }
      }
    }
    ctx.stroke();
  }

  ctx.restore();
}

window.addEventListener('click', pickPoints);
canvas {
border: 1px solid black;
}
div {
display: flex;
}<div><canvas></canvas><p> Click for new points</p></div>最佳答案
您的dot 乘积函数没有问题。这就是您使用它的方式:
expand = (1 + -dot(points[0].direction, points[1].direction)) / 2 * Math.PI;
应该是:
expand = Math.acos(dot(points[0].direction, points[1].direction));
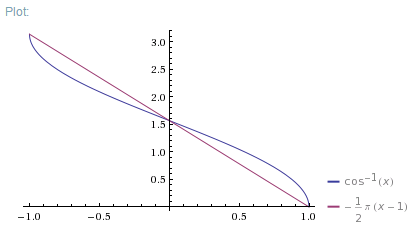
您使用的 expand 变量是一个 Angular (以弧度表示)。 dot 乘积为您提供 Angular 余弦值,但不是 Angular 本身。虽然输入 [0,pi] 的 Angular 余弦值在 1 和 -1 之间变化,但该值不会线性映射回 Angular 本身。
换句话说,它不起作用,因为 Angular 余弦不能简单地通过缩放来转换为 Angular 本身。这就是反正弦的用途。
请注意,一般来说,如果您只需要一个近似值,通常可以使用原始公式(或将 [-1,1] 域映射到 [0,pi] 范围的任何简单公式),但它永远不会给出一个精确的 Angular ,除非在极端情况下。
这可以通过 plotting the two functions on top of each other 直观地看到:
关于javascript - 如何在 2 个单位向量之间弯曲单位网格,我们在Stack Overflow上找到一个类似的问题: https://stackoverflow.com/questions/35728518/