我想在图表上移动鼠标时显示 x 和 y 坐标。
我计算了 x 和 y 坐标,但不确定如何在该点附近的图形上显示(最好像 (x,y) this
connect(ui->customPlot, SIGNAL(mouseRelease(QMouseEvent*)), this, SLOT(mouseRelease(QMouseEvent*)));
connect(ui->customPlot, SIGNAL(mousePress(QMouseEvent*)), this, SLOT(mousePress(QMouseEvent*)));


float MainWindow::findX(QCustomPlot* customPlot, QCPCursor* cursor1, QMouseEvent* event)
{

    double x = customPlot->xAxis->pixelToCoord(event->pos().x());
    double y = customPlot->yAxis->pixelToCoord(event->pos().y());

    // I think I need to write a function here which will display the text on the graph.
}

void MainWindow::mouseRelease(QMouseEvent* event)
{
    if (event->button() == Qt::LeftButton) {
        static QCPCursor cursor1;
        QCustomPlot* plot = (QCustomPlot*)sender();
        float x = findX(plot, &cursor1, event);
    }
}

void MainWindow::mousePressed(QMouseEvent* event)
{
    if (event->button() == Qt::RightButton) {
        QCustomPlot* plot = (QCustomPlot*)sender();
        plot->setContextMenuPolicy(Qt::CustomContextMenu);
        connect(plot, SIGNAL(customContextMenuRequested(const QPoint&)), this, SLOT(ShowContextMenu(const QPoint&)));
    }
}
最佳答案
您可以创建一个 QCPItemText 并放置文本并将其移动到您使用 pixelToCoord 获得的位置。
*.h
private:
    QCPItemText *textItem;

private slots:
    void onMouseMove(QMouseEvent* event);
*.cpp
MainWindow::MainWindow(QWidget *parent) :
QMainWindow(parent),
ui(new Ui::MainWindow)
{
ui->setupUi(this);
textItem = new QCPItemText(ui->customPlot);
connect(ui->customPlot, &QCustomPlot::mouseMove, this, &MainWindow::onMouseMove);
}
void MainWindow::onMouseMove(QMouseEvent *event)
{
QCustomPlot* customPlot = qobject_cast<QCustomPlot*>(sender());
double x = customPlot->xAxis->pixelToCoord(event->pos().x());
double y = customPlot->yAxis->pixelToCoord(event->pos().y());
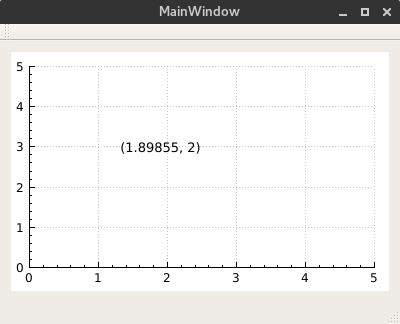
textItem->setText(QString("(%1, %2)").arg(x).arg(2));
textItem->position->setCoords(QPointF(x, y));
textItem->setFont(QFont(font().family(), 10));
customPlot->replot();
}
下图显示了结果,但由于某种原因,我的捕获没有拍摄我的指针的图像。
关于c++ - 在 QCustomplot 中的图形上显示 x 和 y 坐标,我们在Stack Overflow上找到一个类似的问题: https://stackoverflow.com/questions/44294906/