我是数据科学领域的新手。我正在尝试找出我的数据集的特征重要性排名。我已经应用了随机森林并得到了输出。
这是我的代码:
# importing libraries

import pandas as pd
import numpy as np
import matplotlib.pyplot as plt
%matplotlib inline

# importing dataset

dataset=pd.read_csv('Churn_Modelling.csv')
X = dataset.iloc[:,3:12].values
Y = dataset.iloc[:,13].values

#encoding catagorical data

from sklearn.preprocessing import LabelEncoder, OneHotEncoder

#country
labelencoder_X_1= LabelEncoder()
X[:,1]=labelencoder_X_1.fit_transform(X[:,1])

#gender
labelencoder_X_2= LabelEncoder()
X[:,2]=labelencoder_X_2.fit_transform(X[:,2])

onehotencoder = OneHotEncoder(categorical_features=[0])
X = onehotencoder.fit_transform(X).toarray()


#spliting dataset into test set and train set

from sklearn.model_selection import train_test_split
X_train, X_test, y_train, y_test = train_test_split(X, Y, test_size = 0.20)

from sklearn.ensemble import RandomForestRegressor

regressor = RandomForestRegressor(n_estimators=20, random_state=0)
regressor.fit(X_train, y_train)
在重要性部分,我几乎复制了以下示例: https://scikit-learn.org/stable/auto_examples/ensemble/plot_forest_importances.html
代码如下:
#feature importance
from sklearn.ensemble import ExtraTreesClassifier

importances = regressor.feature_importances_
std = np.std([tree.feature_importances_ for tree in regressor.estimators_],
             axis=0)
indices = np.argsort(importances)[::-1]
print("Feature ranking:")

for f in range(X.shape[1]):
    print("%d. feature %d (%f)" % (f + 1, indices[f], importances[indices[f]]))

# Plot the feature importances of the forest
plt.figure()
plt.title("Feature importances")
plt.bar(range(X.shape[1]), importances[indices],
       color="r", yerr=std[indices], align="center")
plt.xticks(range(X.shape[1]), indices)
plt.xlim([-1, X.shape[1]])
plt.show()
我期待文档中显示的输出。任何人都可以帮助我吗?提前致谢。
我的数据集在这里:

最佳答案
你有很多特征,无法在单个图中看到。 只是绘制其中的一些。
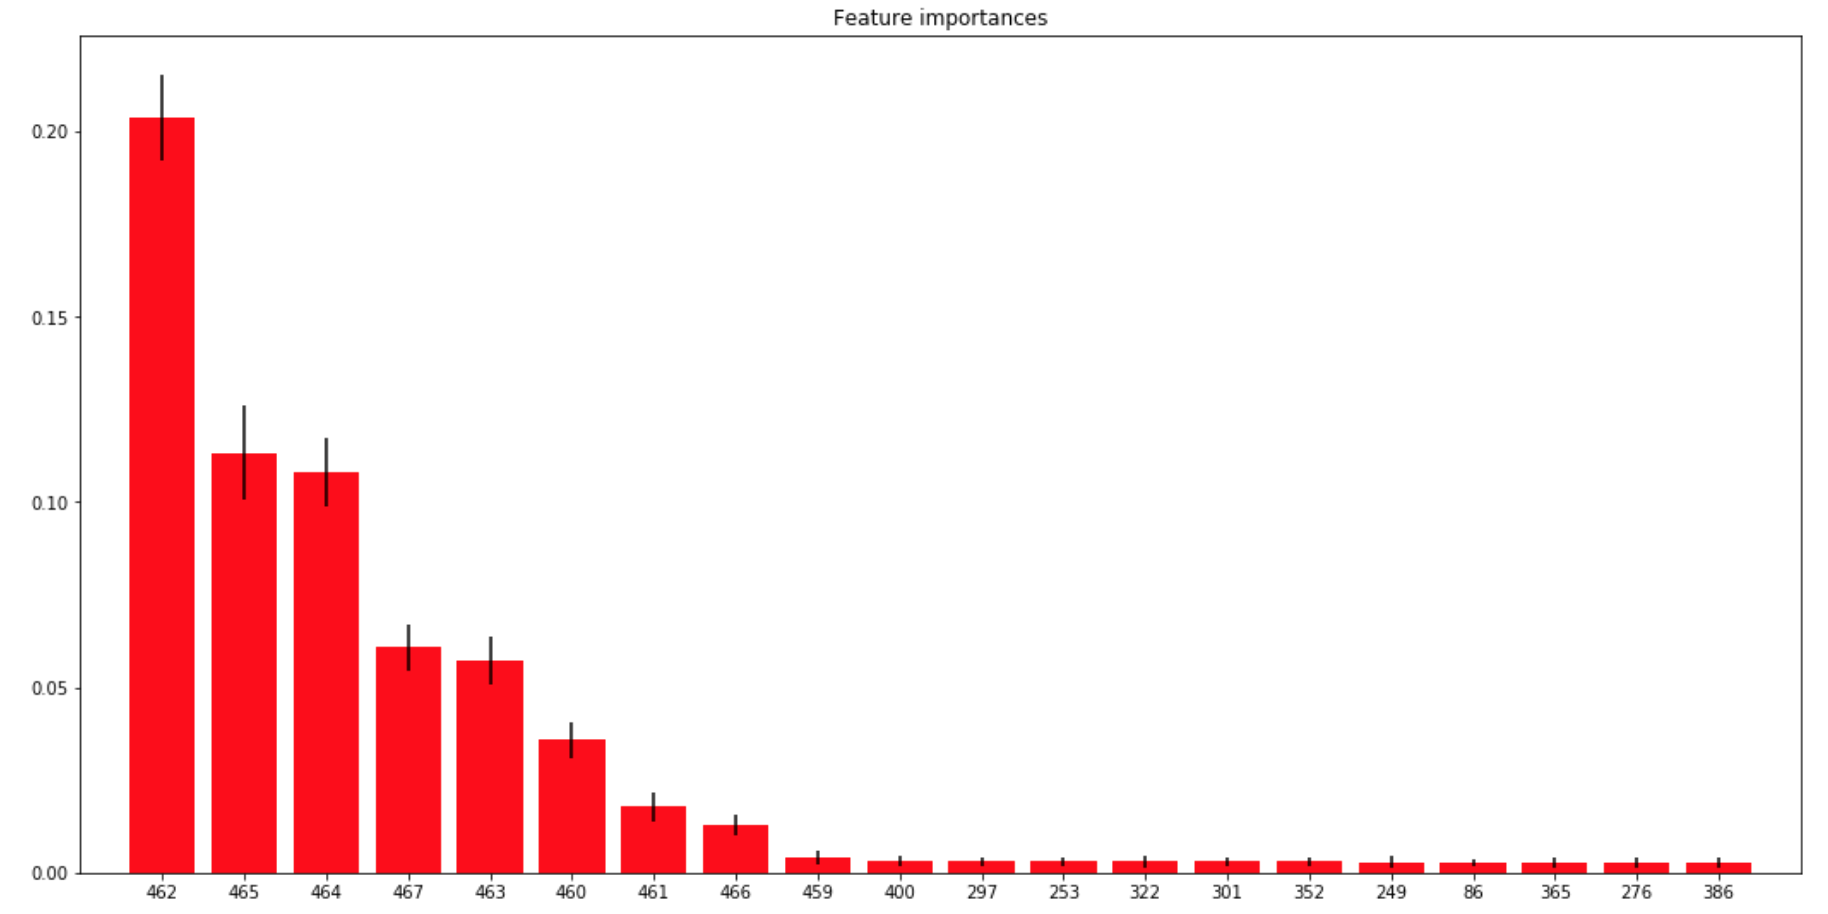
这里我绘制了前 20 个最重要的:
# Plot the feature importances of the forest
plt.figure(figsize=(18,9))
plt.title("Feature importances")
n=20
_ = plt.bar(range(n), importances[indices][:n], color="r", yerr=std[indices][:n])
plt.xticks(range(n), indices)
plt.xlim([-1, n])
plt.show()
我的代码以备不时之需:https://filebin.net/be4h27swglqf3ci3
输出:
关于python - 在 RandomForestRegressor sklearn 中绘制特征重要性,我们在Stack Overflow上找到一个类似的问题: https://stackoverflow.com/questions/56725486/