我正在绘制一些数据的 Wigner 分布,在分布的极端部分,值趋向于接近 0。它也趋向于剧烈震荡,使我的测试图看起来像这样:
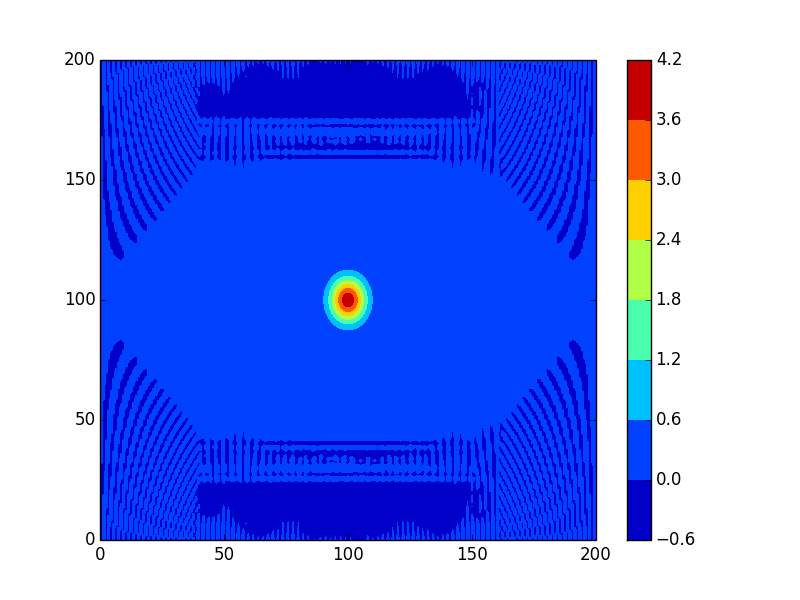
蓝色“海”中的波浪的振幅在 1E-18 左右,但因为它们在 0 附近振荡,所以它们穿过颜色条中的一条线。
如何制作颜色以为零而不是以零为边界值的 contourf() 图?
最佳答案
我想你想要这样的东西:
class set_cbar_zero(Normalize):
  """
  set_cbar_zero(midpoint = float)       default: midpoint = 0.

  Normalizes and sets the center of any colormap to the desired valua which
  is set using midpoint.
  """
  def __init__(self, vmin = None, vmax = None, midpoint = 0., clip = False):
    self.midpoint = midpoint
    Normalize.__init__(self, vmin, vmax, clip)

  def __call__(self, value, clip = None):
    x, y = [self.vmin, self.midpoint, self.vmax], [0, 0.5, 1]
    return numpy.ma.masked_array(numpy.interp(value, x, y))
如果我理解正确的话,你可以将颜色条归一化,这应该可以解决你的问题
import numpy
import matplotlib.pylab as plt

data = numpy.random.random((30, 95))

plt.figure()
plt.imshow(data, cmap = "hot", norm = set_cbar_zero())
plt.show()
关于python - 我怎样才能让 matplotlib 制作一个颜色以 0 为中心的颜色条?,我们在Stack Overflow上找到一个类似的问题: https://stackoverflow.com/questions/23352215/