我想计算正态分布数据的百分位数,所以我首先将数据拟合成正态分布,示例如下:
from scipy.stats import norm
import numpy as np
from scipy.optimize import curve_fit
import matplotlib.pyplot as plt

x = np.array([ 0.47712125,  0.5445641 ,  0.61193563,  0.67924615,  0.74671202,
    0.81404772,  0.88144172,  0.94885291,  1.01623919,  1.08361011,
    1.15100191,  1.21837793,  1.28578227,  1.3531658 ,  1.42054981,
    1.48794397,  1.55532424,  1.62272161,  1.69010744,  1.75749472,
    1.82488047,  1.89226717,  1.9596566 ,  2.02704774,  2.09443269,
    2.16182302,  2.2292107 ,  2.29659719,  2.36398595,  2.43137342,
    2.49876254,  2.56614983,  2.63353814,  2.700926  ,  2.76831392,
    2.83570198,  2.90308999,  2.97008999,  3.03708997,  3.10408999,
    3.17108999,  3.23808998,  3.30508998,  3.37208999,  3.43908999,
    3.50608998,  3.57308998,  3.64008999,  3.70708999,  3.77408999,
    3.84108999,  3.90808999])
y = array([  0.00000000e+00,   0.00000000e+00,   0.00000000e+00,
     0.00000000e+00,   0.00000000e+00,   0.00000000e+00,
     0.00000000e+00,   5.50000000e+01,   1.33500000e+02,
     2.49000000e+02,   4.40000000e+02,   7.27000000e+02,
     1.09000000e+03,   1.53000000e+03,   2.21500000e+03,
     3.13500000e+03,   4.44000000e+03,   5.57000000e+03,
     6.77000000e+03,   8.04500000e+03,   9.15500000e+03,
     1.00000000e+04,   1.06000000e+04,   1.06500000e+04,
     1.02000000e+04,   9.29000000e+03,   8.01500000e+03,
     6.50000000e+03,   5.24000000e+03,   4.11000000e+03,
     2.97000000e+03,   1.86000000e+03,   1.02000000e+03,
     5.26500000e+02,   2.49000000e+02,   1.11000000e+02,
     5.27000000e+01,   6.90825000e+00,   4.54329000e+00,
     3.63846500e+00,   3.58135000e+00,   2.37404000e+00,
     1.81840000e+00,   1.20159500e+00,   6.02470000e-01,
     3.43295000e-01,   1.62295000e-01,   7.99350000e-02,
     3.60750000e-02,   1.50000000e-02,   3.61500000e-03,
     8.00000000e-05])

def datafit(x,N,u,sig):
    y = N/(np.sqrt(2*np.pi)*sig)*np.exp(-(x-u)**2/2*sig**2)
    return y
popt,popc = curve_fit(datafit,x,y,p0=[np.max(y),2,2])
Normal_distribution = norm(loc = popt[-2],scale = popt[-1])
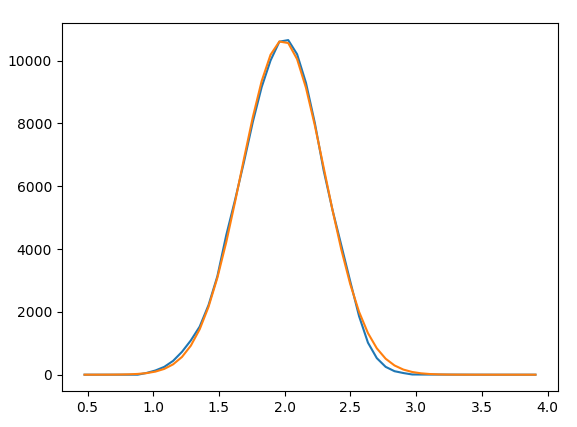
然后我检查了 (x,y) 和 (x,popt[0]*Normal_distribution.pdf(x)) 的图是否相同,但结果显示它们完全不同......

蓝线是 (x,y) 的图,橙色线是 (x,popt[0]*Normal_distribution.pdf(x) 的图。
为什么会发生这种情况?我的代码有什么问题吗?
最佳答案
取决于你绘制的内容,这些对我来说看起来不错:
plt.plot(x,y)
Out[3]: [<matplotlib.lines.Line2D at 0xb9cef98>]

popt,popc
Out[4]:
(array([  8.41765250e+04,   1.98651581e+00,   3.15537860e+00]),
 array([[  5.64670700e+05,   1.12782889e-05,   1.15455042e+01],
        [  1.12782889e-05,   2.91058556e-06,   2.73909077e-10],
        [  1.15455042e+01,   2.73909077e-10,   2.88523818e-04]]))

plt.plot(x,datafit(x,*popt))
Out[5]: [<matplotlib.lines.Line2D at 0xb990080>]
我的猜测是您的 datafit def 与norm() 中的 sig、scale 和 *,/存在错误
我重写了 datafit 以匹配 scipynorm.pdf
仍然存在~pi问题的因素,这可能只是定义性的:https://en.wikipedia.org/wiki/Normal_distribution
哎呀,看起来“pi 因子”只是您的特定数据的巧合
重读norm.pdf def建议整体按“比例”因子重新调整,所以现在我认为应该是:
'''
norm.pdf(x) = exp(-x**2/2)/sqrt(2*pi)
norm.pdf(x, loc, scale) == norm.pdf(y) / scale with y = (x - loc) / scale
'''
def datafit(x,N,u,sig):
# y = N/(np.sqrt(2*np.pi)*sig)*np.exp(-(x-u)**2/2*sig**2)
y = N*np.exp(-((x-u)/sig)**2/2)/(np.sqrt(2*np.pi))
return y
popt,popc = curve_fit(datafit,x,y,p0=[np.max(y),2,2])
# scipy norm.pdf with scaling factors to match datafit()
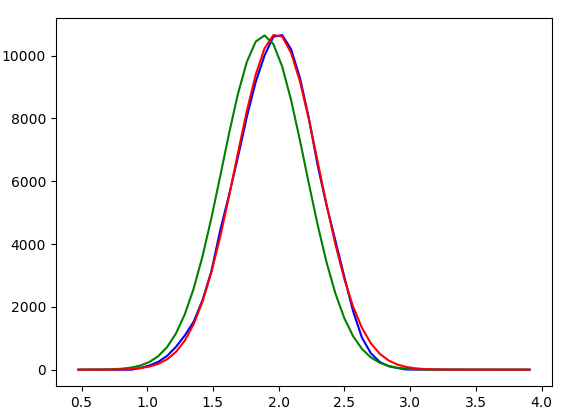
Normal_distribution = popt[0]*popt[2]*norm.pdf(x, popt[1], popt[2])
plt.plot(x,y, 'b')
plt.plot(x, datafit(x+.1, *popt), 'g')
plt.plot(x, Normal_distribution, 'r')
关于python - Python中正态分布的曲线拟合,我们在Stack Overflow上找到一个类似的问题: https://stackoverflow.com/questions/42882309/