我有一组这种格式的点云:
x = [1.2, 1.3, .....]
y = [2.1, 1.2, .....]
z = [0.5, 0.8, .....]
我使用 plot_trisurf 绘制(通过 Delauney 三角测量)“代表”点云的 3D 表面。
我的问题是:是否有一种快速/合适的方法可以将 plot_trisurf 生成的表面投影到 xy 平面,并且仅将投影的轮廓绘制为 2D 图?
例如,假设点云中的所有点都在球面上,那么 plot_trisurf 将为我绘制一个(不那么完美的)球体。然后我的目标是将这个球体“投影”到 xy 平面,然后将其轮廓绘制为 2D 图(这是一个圆圈)。
编辑:
请注意,此2D plot 是一个二维曲线(可能是闭合曲线)。
最佳答案
您可以使用 trimesh 或类似模块来快速实现您的目标,而无需重新发明轮子,因为此类库已经实现了处理网格的方法。
请参阅下面将曲面投影到任意平面的快速实现,该任意平面由其法向量和原点定义。
import numpy as np
from mpl_toolkits.mplot3d import Axes3D
import matplotlib.pyplot as plt
import trimesh

mesh = trimesh.load('./teapot.obj')
triangles = mesh.faces
nodes = mesh.vertices

x = nodes[:,0]
y = nodes[:,2]
z = nodes[:,1]

# Section mesh by an arbitrary plane defined by its normal vector and origin
section = mesh.section([1,0,1], [0,0,0])

fig = plt.figure()
ax = fig.gca(projection='3d')
ax.plot_trisurf(x, y, z, triangles=triangles, color=(0,1,0,0.3), alpha=0.3)
ax.scatter(section.vertices[:,0], section.vertices[:,2], section.vertices[:,1])

plt.axis([-3, 3, -3, 3])
plt.show()
结果是:
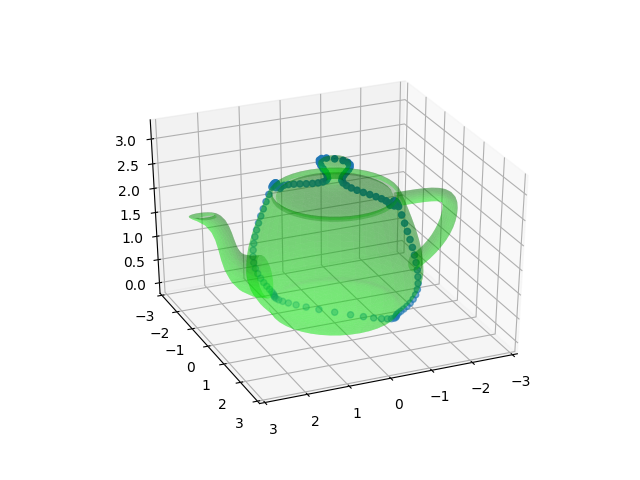
希望对您有所帮助!
关于python - 将 3D 表面(由 plot_trisurf 生成)投影到 xy 平面并绘制 2D 轮廓,我们在Stack Overflow上找到一个类似的问题: https://stackoverflow.com/questions/59167152/