如何更改 matplotlib 极坐标图“r”轴的位置?
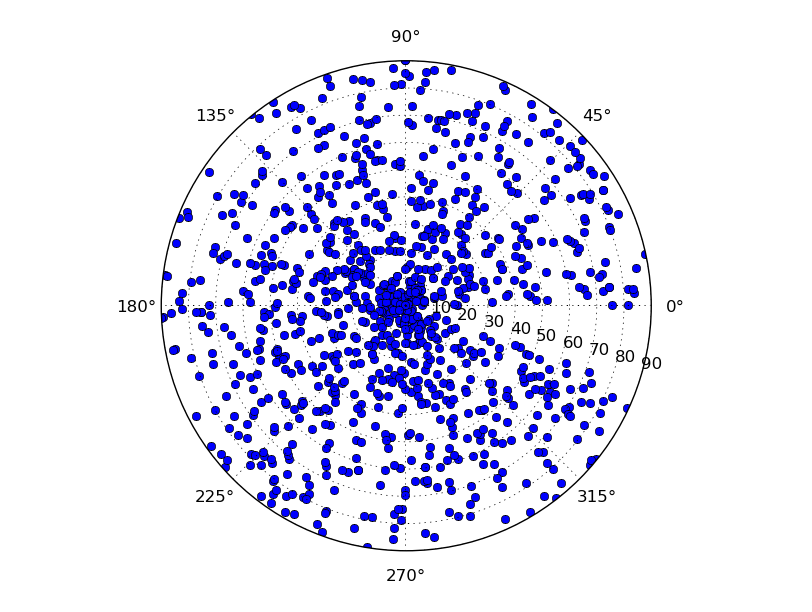
我正在尝试更改极坐标图中 r 轴的位置。 目前它被数据掩盖了,但是数据在 theta = 340-360 度处有一个间隙(在我的真实数据示例中,这实际上约为 45 度),所以如果我可以把数据间隙中的轴标签。
import random
import numpy as np
import matplotlib.pyplot as plt
sampleSize=1000
az=[]
inc=[]
for i in range(sampleSize):
    az.append(random.randint(0,340)) #not to the full 360 to represent my natural gap in the data
    inc.append(random.randint(0,90))

plt.figure()
plt.polar(np.radians(az),inc,'o')
plt.show()
最佳答案
我能想到的一种方法是使用 .set_rgrids 方法:
f=plt.figure()
ax = f.add_axes([0.1, 0.1, 0.8, 0.8], projection='polar')
ax.plot(np.radians(az), inc, 'o')
ax.set_rgrids([10,20,30,40,50,60,70,80,90], angle=345.)
关于python - 如何更改 matplotlib 极坐标图 'r' 轴的位置?,我们在Stack Overflow上找到一个类似的问题: https://stackoverflow.com/questions/19480317/