我想在 matplotlib 中创建椭圆,其填充颜色的 alpha(不透明度)值取决于半径;
例如,二维高斯。
Is there any way to do this?
可以很容易地创建具有颜色渐变的矩形图(如 Gradient facecolor matplotlib bar plot 和 this ),但我不知道如何对圆/椭圆做同样的事情。
最佳答案
这是使用 Alex 帖子中的想法的函数示例
import matplotlib.pyplot as plt,numpy as np

def gauplot(centers, radiuses, xr=None, yr=None):
        nx, ny = 1000.,1000.
        xgrid, ygrid = np.mgrid[xr[0]:xr[1]:(xr[1]-xr[0])/nx,yr[0]:yr[1]:(yr[1]-yr[0])/ny]
        im = xgrid*0 + np.nan
        xs = np.array([np.nan])
        ys = np.array([np.nan])
        fis = np.concatenate((np.linspace(-np.pi,np.pi,100), [np.nan]) )
        cmap = plt.cm.gray
        cmap.set_bad('white')
        thresh = 3
        for curcen,currad in zip(centers,radiuses):
                curim=(((xgrid-curcen[0])**2+(ygrid-curcen[1])**2)**.5)/currad*thresh
                im[curim<thresh]=np.exp(-.5*curim**2)[curim<thresh]
                xs = np.append(xs, curcen[0] + currad * np.cos(fis))
                ys = np.append(ys, curcen[1] + currad * np.sin(fis))
        plt.imshow(im.T, cmap=cmap, extent=xr+yr)
        plt.plot(xs, ys, 'r-')
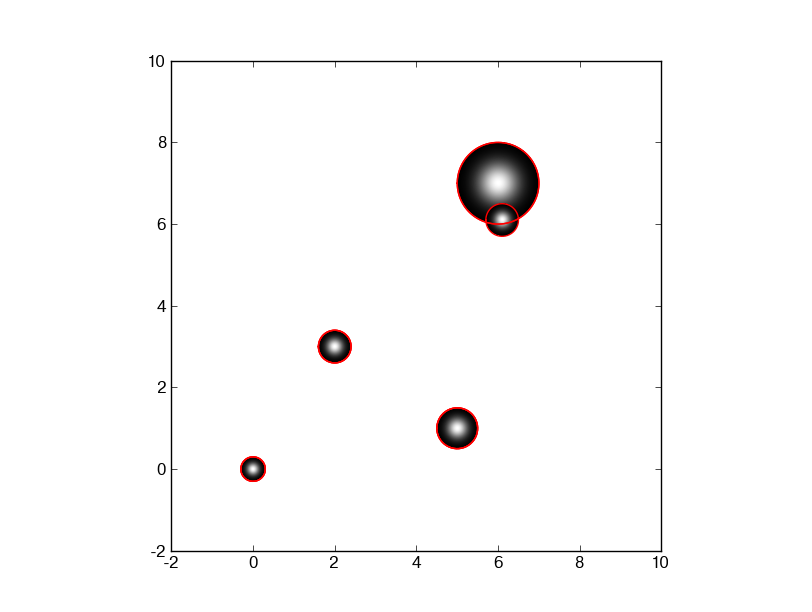
这是你运行时得到的结果
    gauplot([(0,0), (2,3), (5,1), (6, 7), (6.1, 6.1)], [.3,. 4, .5, 1, .4], [-1,10], [-1,10])
             #           centers of circles           # radii of circles#
关于python - 补丁中的 matplotlib 颜色渐变?,我们在Stack Overflow上找到一个类似的问题: https://stackoverflow.com/questions/44325352/