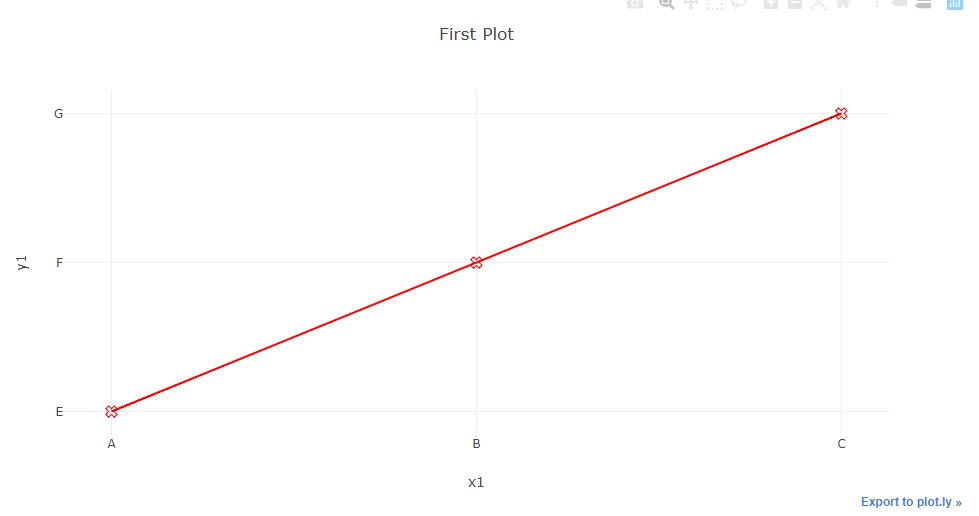
让我举个例子。让我们采用显示的简单线图 here , Plotly 用户指南中的第一张图:
from plotly.offline import download_plotlyjs, init_notebook_mode, plot, iplot
import plotly.graph_objs as go

trace1 = go.Scatter(x=[1,2,3], y=[4,5,6], marker={'color': 'red', 'symbol': 104, 'size': 10},
                    mode="markers+lines",  text=["one","two","three"], name='1st Trace')

data=go.Data([trace1])
layout=go.Layout(title="First Plot", xaxis={'title':'x1'}, yaxis={'title':'x2'})
figure1=go.Figure(data=data,layout=layout)
init_notebook_mode(connected=True)
iplot(figure1)

现在,假设我想将 x-tick 标签更新为 'A', 'B', 'C' 并将 ytick 标签更新为 'E', 'F', 'G'。我可以通过像这样更新图形来做到这一点:
figure1['data'][0]['x']=['A', 'B', 'C']
figure1['data'][0]['y']=['E', 'F', 'G']

iplot(figure1)
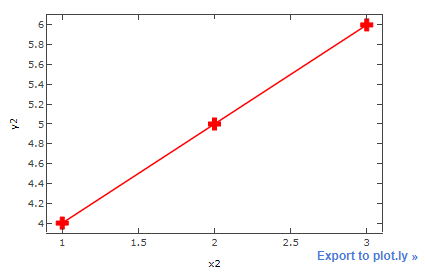
到目前为止一切顺利。但是,假设我首先使用 matplotlib 绘制图形,然后像这样转换为 plotly:
import matplotlib.pyplot as plt
import plotly.tools as tls

plt.plot([1,2,3], [4,5,6], 'r+-', markersize=10)
plt.xlabel('x2')
plt.ylabel('y2')

mpl_fig = plt.gcf()
figure2 = tls.mpl_to_plotly(mpl_fig)

init_notebook_mode(connected=True)
iplot(figure2)
例如,当您用来绘制图形的库设计为仅适用于 matplotlib(或者最大可能是 seaborn)时,这是相关的。但是您想使绘图动态/交互并在绘图中使用它们。
这一次,如果我尝试以与之前完全相同的方式更新图形,我会得到一个空白图形!
figure2['data'][0]['x']=['A', 'B', 'C']
figure2['data'][0]['y']=['E', 'F', 'G']

iplot(figure2)
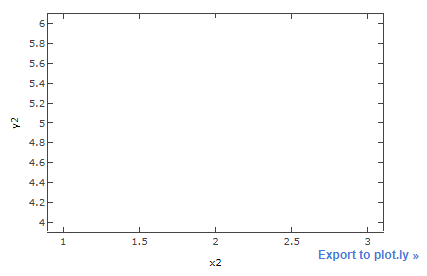
不仅是一张空白图,xtick标签和ytick标签也没有改变。
当我深入查看 figure1['data'][0]['x'] 中包含的内容时,我发现它是一个元组:
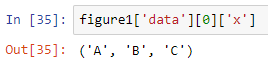
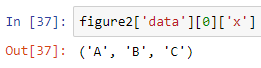
当我检查 figure2['data'][0]['x'] 中包含的内容时,它也是完全相同的元组:
同样适用于 figure1['data'][0]['y'] 和 figure2['data'][0]['y'] -它们都包含元组 ('E', 'F', 'G')。
所以,这是怎么回事?为什么 figure2 在更新刻度标签后没有被绘制?我该如何解决?
最佳答案
到目前为止,我通过 self 修修补补找到的解决方法是基本上用空白布局替换布局。出于某种原因,从 matplotlib 转换的 plotly graph 的布局似乎导致无法反射(reflect)对图形的更新。将布局设为空白后(然后,如果需要,向其中添加内容,例如标题和轴标签,如下所示),它似乎工作正常:
figure2['layout'] = {'title':'First plot', 'xaxis':{'title':'x2'}, 'yaxis':{'title':'y2'}}

figure2['data'][0]['x']=['A', 'B', 'C']
figure2['data'][0]['y']=['E', 'F', 'G']

iplot(figure2)

关于python - 在 Plotly 中更改/更新 xtick 标签和 ytick 标签不一致,我们在Stack Overflow上找到一个类似的问题: https://stackoverflow.com/questions/55351080/