我正在从事图像分割工作,测试了很多不同的分割算法,以便进行比较研究。目前我已经实现了 k 均值算法。我想自动计算图像中分割的对象(每个图像上的粉色对象和绿色对象)。我有专家进行了手动计数,因此我想比较结果。
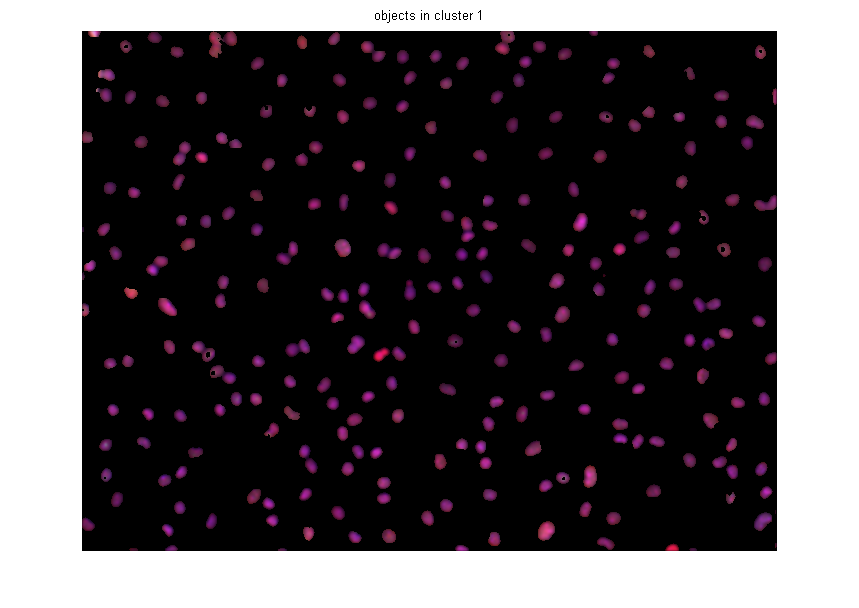
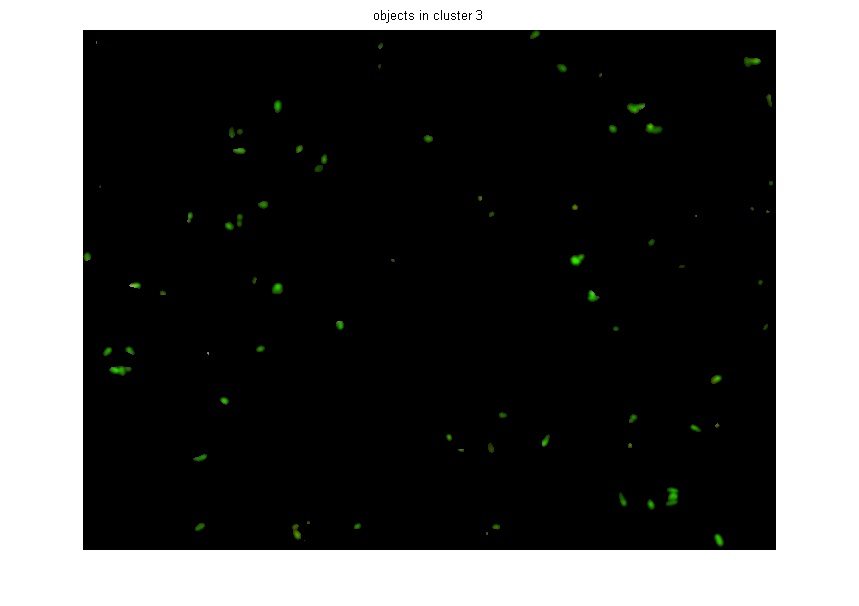
我的输入图像是:

我的结果图像是:
有什么方法可以让我自动化这个过程吗?
你能帮我一下吗?
提前非常感谢。约翰
最佳答案
好吧,这个方法很大程度上基于 link ImNt 发布了一些关于 matlabs 的文章 label2rgb例子。我不确定如何对区域进行聚类,但从聚类中获得的任何掩码/结果都应用作我的代码的输入
这两个示例中缺少的部分是对簇进行计数。获取聚类数量的关键是使用标签函数的输出。标签函数将所有连接的像素组标记为从 1 到 NUMBER_OF_LABELS,因此使用 max(labels(:)) 与计算所有簇的数量相同
我以完全相同的方式处理两个集群,通常我不会保留所有中间变量,它们就在这里,以便您可以在每次操作后看到输出
基本轮廓
- Get binary mask (you can customize this)
- fill in any holes
- remove small regions (you can customize this)
- label all regions (this is basically connected component grouping)
- count regions
matlab代码
%% creates binary masks for each cluster
cluster1 = imread('cluster1.png');
cluster1 = rgb2gray(cluster1);
cluster2 = imread('cluster2.png');
cluster2 = rgb2gray(cluster2);
%im not sure how you found these clusters 1/2, but using that original mask is
%better than using this 'graythresh' Since I didn't have your original
%clustering output I tried to reconstruct it w
bw1 = im2bw(cluster1,graythresh(cluster1));
bw2 = im2bw(cluster2,graythresh(cluster2));
%alternate method for constructing binary images
%my_gray_thresh = 0
%bw1 = cluster1 > my_gray_thresh;
%bw2 = cluster2 > my_gray_thresh;
%% the above could be replaced with the output of your clustering alg
%tries to clean up the image a bit, filling in holes
fill_bw1 = imfill(bw1,'holes');
fill_bw2 = imfill(bw2,'holes');
%takes out regions with less than smallest_area_for_dots
smallest_area_for_dots = 5; %you can play with this parameter
large_bw1 = bwareaopen(fill_bw1, smallest_area_for_dots);
large_bw2 = bwareaopen(fill_bw2, smallest_area_for_dots);
%labels the regions, this is essentially connected component analysis
labels1 = bwlabel(large_bw1);
labels2 = bwlabel(large_bw2);
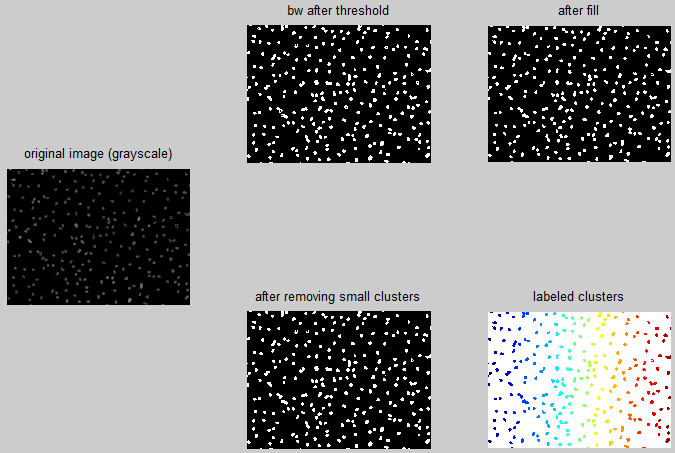
%plots the labeled image
figure(1)
subplot(2,3,[1 4]);imshow(cluster1);title('original image (grayscale)')
subplot(2,3,2);imshow(bw1);title('bw after threshold')
subplot(2,3,3);imshow(fill_bw1);title('after fill')
subplot(2,3,5);imshow(large_bw1);title('after removing small clusters')
subplot(2,3,6);imshow(label2rgb(labels1));title('labeled clusters')
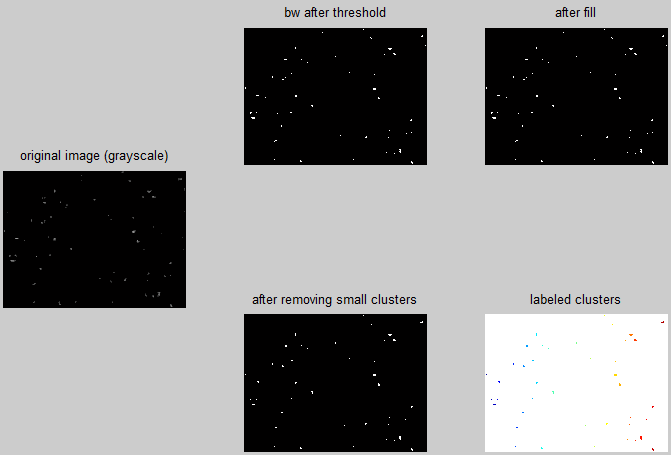
figure(2)
subplot(2,3,[1 4]);imshow(cluster2);title('original image (grayscale)')
subplot(2,3,2);imshow(bw2);title('bw after threshold')
subplot(2,3,3);imshow(fill_bw2);title('after fill')
subplot(2,3,5);imshow(large_bw2);title('after removing small clusters')
subplot(2,3,6);imshow(label2rgb(labels2));title('labeled clusters')
%the number of figures is equal to the number of labels. since labels are
%numbered 1 to NUM_LABELS doing max will get us the number of dots
num_in_cluster1 = max(labels1(:))
num_in_cluster2 = max(labels2(:))
和 matlab 桌面输出
num_in_cluster1 = 243
num_in_cluster2 = 51
和结果图像
关于algorithm - K-means 分割后如何对对象进行计数,我们在Stack Overflow上找到一个类似的问题: https://stackoverflow.com/questions/29878897/