我有一个带有简单十进制值的数组,所以我想要的是我正在使用 SVG Polyline 创建一个 LINECHART,所以我想获得某种 PHP 插件或一段代码,它可以生成 X 和 Y 坐标点我来自一个简单的十进制值数组。
我已经尝试了很多 JS 插件,他们肯定能更好地生成它,但是......!
注意:不幸的是,我无法使用像 d3.js 这样的 JS 插件,我使用的是 WKHTMLTOPDF Linux Binary,它似乎无法与 JS Charts 一起使用。
值数组类似于:
[14,18,4,19,23,34,16,25,5,9,13,15,16]
这是我的演示 SVG 折线:
<svg viewBox="0 0 500 100" style="width: 710px;height: 300px">

  <polyline
     fill="none"
     stroke="rgb(125, 207, 108)"
     stroke-width="4"
     points="
       00,120
       20,60
       40,80
       60,20
       80,80
       100,80
       120,60
       140,100
       160,90
       180,80
       200, 110
       220, 10
       240, 70
       260, 100
       280, 100
       300, 40
       320, 0
       340, 100
       360, 100
       380, 120
       400, 60
       420, 70
       440, 80
     "
   />

</svg>
更新:
感谢@Paul LeBeau
我现在可以生成折线图了,但你能不能也把 x 轴值添加到下面图表上的每个点。那真的很棒,而且我怎样才能将图表展开以覆盖整个页面:
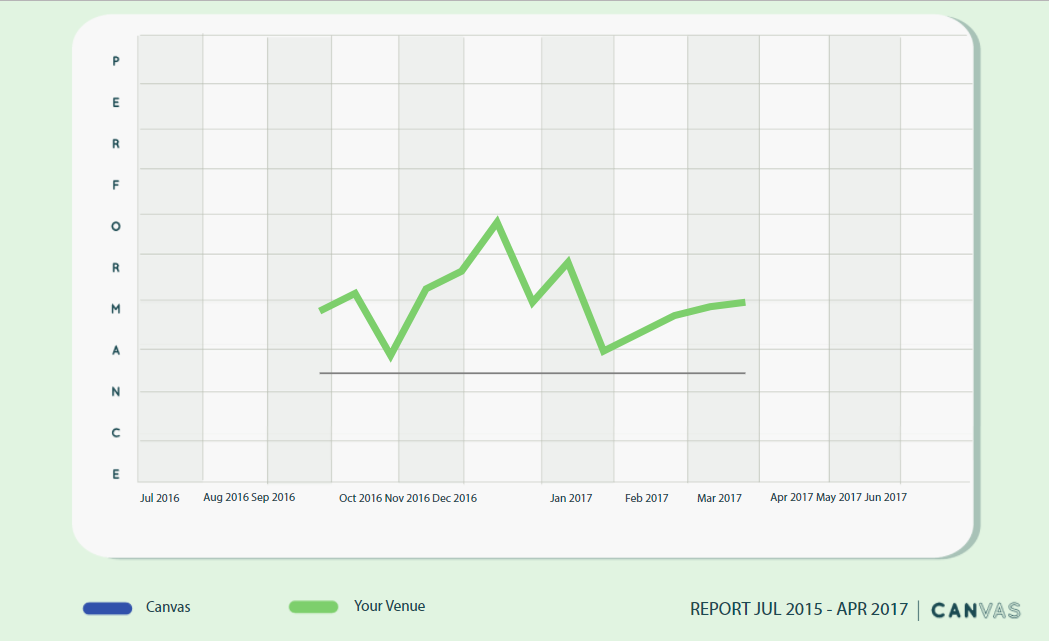
x 轴下方的值应显示为 2016 年 7 月等:
这里是新数据的数组:
$data=["Jul 2014"=>[16],
               "Aug 2014"=>[14],
               "Sep 2014"=>[18],
               "Oct 2014"=>[4],
               "Nov 2014"=>[19],
               "Dec 2014"=>[23],
               "Jan 2015"=>[34],
               "Feb 2015"=>[16],
               "Mar 2015"=>[25],
               "Apr 2015"=>[5],
               "May 2015"=>[9],
               "Jun 2015"=>[13],
               "Jul 2015"=>[15]];
这里是 Lincharts 的 PHP 代码:
$values = [14,18,4,19,23,34,16,25,5,9,13,15,16];

$xOrigin = 90;   // Position of the start (left) of the X axis
$yOrigin = 100;  // Position of the start (bottom) of the Y axis
$xScale = 20;    // Scale for the X axis
$yScale = 2.5;   // Scale for the Y axis

// Get the max value in the $values array so we know how tall to make the Y axis
$yMax = max($values);

$linechart = "";

  $linechart .= '<g transform="translate('.$xOrigin.','.$yOrigin.')" fill="none" stroke="grey">';
    $linechart .= '<line id="xaxis" x1="0" y1="0" x2="'.$xScale*(count($values)-1).'" y2="0" />';
    $linechart .= '<line id="yaxis" x1="0" y1="0" x2="0" y2=".'-$yScale*$yMax.'" />';

  $points = "";
   for ($i = 0; $i < count($values); $i++) {
          if ($i != 0)
            $points .= ", ";
          $points .=($i * $xScale) . "," . ($values[$i] * -$yScale);
        }


$polyline = "";
$polyline .= '<polyline
      stroke="rgb(125, 207, 108)"
      stroke-width="4"
      points="'.$points.'"/>
  </g>';


$page6 = <<<EOD
<svg viewBox="0 0 500 100" style="width: 710px;height: 300px;position: absolute;top: 3135px;left: 130px;">

      $linechart;

      $polyline

    </svg>
EOD;
这是报告的链接,其中包含我将其嵌入的 LINECHART:http://huntedhunter.com/venue_report/
最佳答案
这里是一些 PHP 代码,用于绘制带有 X 轴和 Y 轴的简单折线图。
$values = [14,18,4,19,23,34,16,25,5,9,13,15,16];

$xOrigin = 90;   // Position of the start (left) of the X axis
$yOrigin = 100;  // Position of the start (bottom) of the Y axis
$xScale = 20;    // Scale for the X axis
$yScale = 2.5;   // Scale for the Y axis

// Get the max value in the $values array so we know how tall to make the Y axis
$yMax = max($values);

?><svg viewBox="0 0 500 100" style="width: 710px;height: 300px">

  <g transform="translate(<?=$xOrigin?>, <?=$yOrigin?>)" fill="none" stroke="grey">
    <line id="xaxis" x1="0" y1="0" x2="<?= $xScale*(count($values)-1) ?>" y2="0" />
    <line id="yaxis" x1="0" y1="0" x2="0" y2="<?= -$yScale*$yMax ?>" />

    <polyline
      stroke="rgb(125, 207, 108)"
      stroke-width="4"
      points="<?php

        // Loop through all the entries in the $values array
        // Echo "x,y" coordinates to the page to fill in the
        // points attribute of the <polyline> element.
        for ($i = 0; $i < count($values); $i++) {
          // If this is not the first x,y pair, then output a
          // comma to separate one x,y pair from the next
          if ($i != 0)
            echo ", ";
          // Output a single x,y pair.  Each x and y values are
          // multiplied by a scale factor. $yScale is negative because
          // in an SVG y coordinates increase down the page, but we want larger
          // Y to go up the page.
          echo ($i * $xScale) . "," . ($values[$i] * -$yScale);
        }

      ?>"/>
  </g>

</svg>
一些SVG内容的解释:
<g transform="translate(<?=$xOrigin?>, <?=$yOrigin?>)" fill="none" stroke="grey">
这<g>元素是一个 SVG 组。组只是指定一些由所有组子级继承的属性的方法。所以我们可以设置 fill没有,和stroke颜色在这里变成灰色,我们不必为每个 child 指定它。
transform="translate()"属性导致子组在页面上移动 $xOrigin , $yOrigin位置。我们这样做是为了简化下图。我们可以创建我们的图形和轴,就好像它们是基于 (0,0) 一样。然后转换将所有内容移动到页面上的最终位置。
<line id="xaxis" x1="0" y1="0" x2="<?= $xScale*(count($values)-1) ?>" y2="0" />
构成 X 轴的线。来自 (0,0)至 (<no. of values>, 0) .
<line id="yaxis" x1="0" y1="0" x2="0" y2="<?= -$yScale*$yMax ?>" />
形成 Y 轴的线。来自 (0,0)至 (0, <maximum Y value>) .
关于php - 如何从 php 中的数组绘制多段线?,我们在Stack Overflow上找到一个类似的问题: https://stackoverflow.com/questions/45828618/