我正在尝试用高斯(和更复杂的)函数拟合一些数据。我在下面创建了一个小例子。
我的第一个问题是,我做得对吗?
我的第二个问题是,如何在 x 方向(即观察/数据的 x 位置)添加错误?
很难找到关于如何在 pyMC 中进行这种回归的好的指南。也许是因为使用一些最小二乘法或类似方法更容易,但我最终有很多参数,需要看看我们能如何约束它们并比较不同的模型,pyMC 似乎是个不错的选择。
import pymc
import numpy as np
import matplotlib.pyplot as plt; plt.ion()

x = np.arange(5,400,10)*1e3

# Parameters for gaussian
amp_true = 0.2
size_true = 1.8
ps_true = 0.1

# Gaussian function
gauss = lambda x,amp,size,ps: amp*np.exp(-1*(np.pi**2/(3600.*180.)*size*x)**2/(4.*np.log(2.)))+ps
f_true = gauss(x=x,amp=amp_true, size=size_true, ps=ps_true )

# add noise to the data points
noise = np.random.normal(size=len(x)) * .02
f = f_true + noise
f_error = np.ones_like(f_true)*0.05*f.max()

# define the model/function to be fitted.
def model(x, f):
    amp = pymc.Uniform('amp', 0.05, 0.4, value= 0.15)
    size = pymc.Uniform('size', 0.5, 2.5, value= 1.0)
    ps = pymc.Normal('ps', 0.13, 40, value=0.15)

    @pymc.deterministic(plot=False)
    def gauss(x=x, amp=amp, size=size, ps=ps):
        e = -1*(np.pi**2*size*x/(3600.*180.))**2/(4.*np.log(2.))
        return amp*np.exp(e)+ps
    y = pymc.Normal('y', mu=gauss, tau=1.0/f_error**2, value=f, observed=True)
    return locals()

MDL = pymc.MCMC(model(x,f))
MDL.sample(1e4)

# extract and plot results
y_min = MDL.stats()['gauss']['quantiles'][2.5]
y_max = MDL.stats()['gauss']['quantiles'][97.5]
y_fit = MDL.stats()['gauss']['mean']
plt.plot(x,f_true,'b', marker='None', ls='-', lw=1, label='True')
plt.errorbar(x,f,yerr=f_error, color='r', marker='.', ls='None', label='Observed')
plt.plot(x,y_fit,'k', marker='+', ls='None', ms=5, mew=2, label='Fit')
plt.fill_between(x, y_min, y_max, color='0.5', alpha=0.5)
plt.legend()
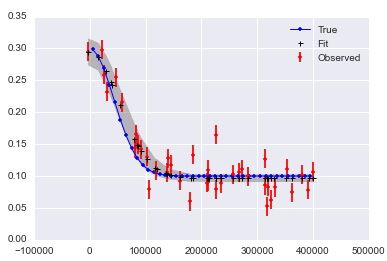
我意识到我可能需要运行更多的迭代,最后使用老化和细化。绘制数据和拟合的图如下所示。

pymc.Matplot.plot(MDL) 图形看起来像这样,显示了很好的峰值分布。这个不错吧?

最佳答案
My first question is, am I doing it right?
是的!你需要包括一个你知道的老化期。我喜欢扔掉我的前半部分 sample 。您不需要进行任何细化,但有时它会使您的 MCMC 后处理更快,存储更小。
我建议的唯一另一件事是设置一个随机种子,以便您的结果是“可重现的”:np.random.seed(12345) 可以解决问题。
哦,如果我真的给出了太多建议,我会说 import seaborn 以使 matplotlib 结果更漂亮。
My second question is, how do I add an error in the x-direction, i.e. in the x-position of the observations/data?
一种方法是为每个错误包含一个潜在变量。这在您的示例中有效,但如果您有更多观察结果,则不可行。我将举一个小例子来帮助您开始这条道路:
# add noise to observed x values
x_obs = pm.rnormal(mu=x, tau=(1e4)**-2)

# define the model/function to be fitted.
def model(x_obs, f):
    amp = pm.Uniform('amp', 0.05, 0.4, value= 0.15)
    size = pm.Uniform('size', 0.5, 2.5, value= 1.0)
    ps = pm.Normal('ps', 0.13, 40, value=0.15)

    x_pred = pm.Normal('x', mu=x_obs, tau=(1e4)**-2) # this allows error in x_obs

    @pm.deterministic(plot=False)
    def gauss(x=x_pred, amp=amp, size=size, ps=ps):
        e = -1*(np.pi**2*size*x/(3600.*180.))**2/(4.*np.log(2.))
        return amp*np.exp(e)+ps
    y = pm.Normal('y', mu=gauss, tau=1.0/f_error**2, value=f, observed=True)
    return locals()

MDL = pm.MCMC(model(x_obs, f))
MDL.use_step_method(pm.AdaptiveMetropolis, MDL.x_pred) # use AdaptiveMetropolis to "learn" how to step
MDL.sample(200000, 100000, 10)  # run chain longer since there are more dimensions
如果 x 和 y 中有噪音,似乎很难得到好的答案:
关于python - 使用 pyMCMC/pyMC 将非线性函数拟合到数据/观察值,我们在Stack Overflow上找到一个类似的问题: https://stackoverflow.com/questions/24804298/