我正在 map 上绘制来自飞机的数据,我想在绘图上最新数据点的坐标处插入这架 75 像素 x 29 像素的飞机 PNG 图像。

据我所知和阅读,pyplot.imshow()是实现这一目标的最佳方式。但是,我在第 1 步上挂断了,让图像均匀显示。使用普通绘图而不是 basemap ,使用 imshow 很容易让图像出现,但是当使用 basemap 时,我根本无法显示它。请参阅示例代码。
如果我可以让图像显示在 map 上,我假设我可以通过反复试验,使用 extent 设置它的位置和一些适当的尺寸。 imshow() 的属性, 绘图坐标从 map 坐标 x,y = m(lons,lats) 转换而来.
这是示例代码(要尝试它,您可能需要下载上面的飞机图像)。
from matplotlib import pyplot as plt
from mpl_toolkits.basemap import Basemap
import Image
from numpy import arange

lats = arange(26,29,0.5)
lons = arange(-90,-87,0.5)

m = Basemap(projection='cyl',llcrnrlon=min(lons)-2,llcrnrlat=min(lats)-2,
            urcrnrlon=max(lons)+2,urcrnrlat=max(lats)+2,resolution='i')

x,y = m(lons,lats)
u,v, = arange(0,51,10),arange(0,51,10)
barbs = m.barbs(x,y,u,v)
m.drawcoastlines(); m.drawcountries(); m.drawstates()

img = Image.open('c130j_75px.png')
im = plt.imshow(img, extent=(x[-1],x[-1]+50000,y[-1],y[-1]+50000))
plt.show()
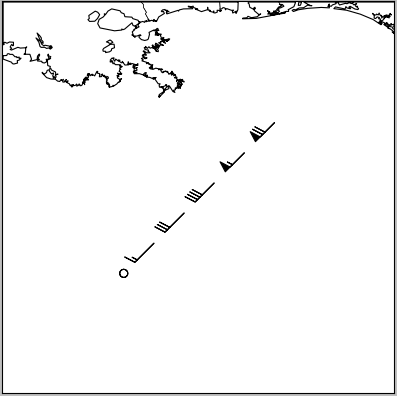
这是生成的图像,其中不包含飞机的痕迹。我用 extent 尝试了几种不同的尺寸。 ,我想我可能只是把它做得太小了,但没有成功。我也试过设置zorder=10 ,但也没有运气。任何帮助将不胜感激。
更新:我现在可以使用 m.imshow 让图像至少出现而不是 plt.imshow ,因为前者传入 map 的轴实例,但 extent论点似乎对图像的尺寸没有影响,因为无论我做多小,它总是填满整个情节extent尺寸,即使我将它们设置为零。如何适当缩放飞机图像并将其定位在最后一个数据点附近?
im = m.imshow(img, extent=(x[-1],x[-1]+5,y[-1],y[-1]+2))
最佳答案
实际上,为此,您想使用 matplotlib 的一些未记录的功能:matplotlib.offsetbox 模块。这里有一个例子:http://matplotlib.sourceforge.net/trunk-docs/examples/pylab_examples/demo_annotation_box.html
在你的情况下,你会做这样的事情:
import matplotlib.pyplot as plt
import numpy as np
import Image
from mpl_toolkits.basemap import Basemap
from matplotlib.offsetbox import OffsetImage, AnnotationBbox
# Set up the basemap and plot the markers.
lats = np.arange(26, 29, 0.5)
lons = np.arange(-90, -87, 0.5)
m = Basemap(projection='cyl',
llcrnrlon=min(lons) - 2, llcrnrlat=min(lats) - 2,
urcrnrlon=max(lons) + 2, urcrnrlat=max(lats) + 2,
resolution='i')
x,y = m(lons,lats)
u,v, = np.arange(0,51,10), np.arange(0,51,10)
barbs = m.barbs(x,y,u,v)
m.drawcoastlines()
m.drawcountries()
m.drawstates()
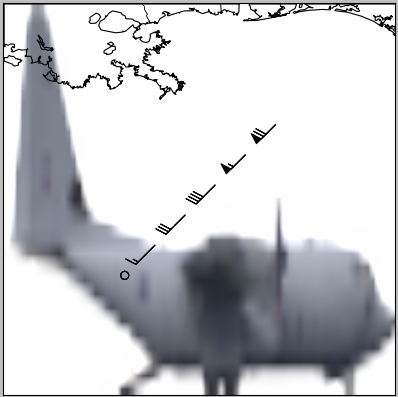
# Add the plane marker at the last point.
plane = np.array(Image.open('plane.jpg'))
im = OffsetImage(plane, zoom=1)
ab = AnnotationBbox(im, (x[-1],y[-1]), xycoords='data', frameon=False)
# Get the axes object from the basemap and add the AnnotationBbox artist
m._check_ax().add_artist(ab)
plt.show()

这样做的好处是平面位于轴坐标中,并且在放大时相对于图形的大小将保持相同的大小。
关于Python Matplotlib Basemap 在 map 图上叠加小图像,我们在Stack Overflow上找到一个类似的问题: https://stackoverflow.com/questions/11487797/