在 Java 中创建美观图表的最佳方法是什么?看起来图表的主要选项是 JFreeChart,但不幸的是,默认情况下它们看起来很普通。
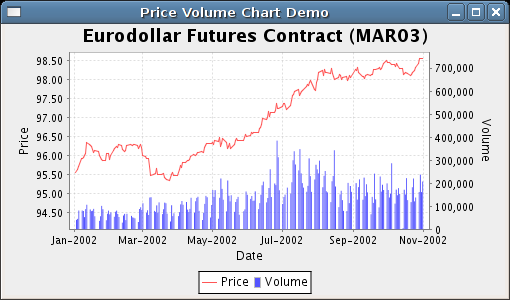
比较 JFreeChart 的示例:http://www.jfree.org/jfreechart/images/PriceVolumeDemo1.png 使用 Javascript 图表库之一,例如 http://www.highcharts.com/demo/spline-symbols/grid或 http://people.iola.dk/olau/flot/examples/graph-types.html
javascript 的看起来更好 - 它们有流畅的线条,默认情况下漂亮的字体,与看起来非常普通的 JFreeChart 相比,整体看起来不错。
是否有一个构建在 JFreeChart 之上的默认情况下看起来不错的图表库,或者一些示例代码可以使普通的 JFreeChart 图表(例如折线图)看起来很棒?
最佳答案
我遇到了同样的问题。
此代码使 JFreeChart 看起来像 Highcharts(目前仅支持条形图)。它可以很容易地变得更有效率:)
    String fontName = "Lucida Sans";
    JFreeChart chart = ChartFactory.createBarChart(null, "", "", dataset, PlotOrientation.VERTICAL, false, true, false );

    StandardChartTheme theme = (StandardChartTheme)org.jfree.chart.StandardChartTheme.createJFreeTheme();

    theme.setTitlePaint( Color.decode( "#4572a7" ) );
    theme.setExtraLargeFont( new Font(fontName,Font.PLAIN, 16) ); //title
    theme.setLargeFont( new Font(fontName,Font.BOLD, 15)); //axis-title
    theme.setRegularFont( new Font(fontName,Font.PLAIN, 11));
    theme.setRangeGridlinePaint( Color.decode("#C0C0C0"));
    theme.setPlotBackgroundPaint( Color.white );
    theme.setChartBackgroundPaint( Color.white );
    theme.setGridBandPaint( Color.red );
    theme.setAxisOffset( new RectangleInsets(0,0,0,0) );
    theme.setBarPainter(new StandardBarPainter());
    theme.setAxisLabelPaint( Color.decode("#666666")  );
    theme.apply( chart );
    chart.getCategoryPlot().setOutlineVisible( false );
    chart.getCategoryPlot().getRangeAxis().setAxisLineVisible( false );
    chart.getCategoryPlot().getRangeAxis().setTickMarksVisible( false );
    chart.getCategoryPlot().setRangeGridlineStroke( new BasicStroke() );
    chart.getCategoryPlot().getRangeAxis().setTickLabelPaint( Color.decode("#666666") );
    chart.getCategoryPlot().getDomainAxis().setTickLabelPaint( Color.decode("#666666") );
    chart.setTextAntiAlias( true );
    chart.setAntiAlias( true );
    chart.getCategoryPlot().getRenderer().setSeriesPaint( 0, Color.decode( "#4572a7" ));
    BarRenderer rend = (BarRenderer) chart.getCategoryPlot().getRenderer();
    rend.setShadowVisible( true );
    rend.setShadowXOffset( 2 );
    rend.setShadowYOffset( 0 );
    rend.setShadowPaint( Color.decode( "#C0C0C0"));
    rend.setMaximumBarWidth( 0.1);

关于java - 在 Java 中创建时尚的图表,例如使用 JFreeChart,我们在Stack Overflow上找到一个类似的问题: https://stackoverflow.com/questions/8264818/