我使用 Seaborn 和 pandas 数据框 (data) 创建了这个图:
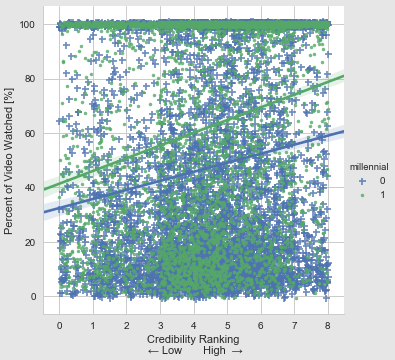
我的代码:
g = sns.lmplot('credibility', 'percentWatched', data=data, hue = 'millennial', markers = ["+", "."], x_jitter = True, y_jitter = True, size=5)
g.set(xlabel = 'Credibility Ranking\n ← Low       High  →', ylabel = 'Percent of Video Watched [%]')
您可能会注意到该图的图例标题只是变量名称('millennial'),而图例项是变量的值(0、1)。如何编辑图例的标题和标签?理想情况下,传说的标题是“一代”,标签是“千禧一代”和“老一代”
最佳答案
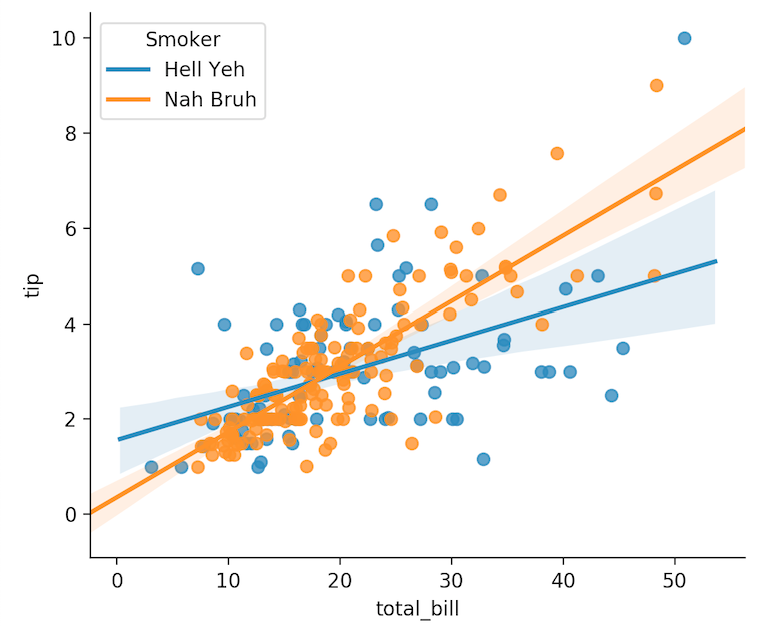
我花了一些时间阅读以上内容。这就是我的答案:
import seaborn as sns
import matplotlib.pyplot as plt
tips = sns.load_dataset("tips")

g = sns.lmplot(
    x="total_bill",
    y="tip",
    hue="smoker",
    data=tips,
    legend=False
)

plt.legend(title='Smoker', loc='upper left', labels=['Hell Yeh', 'Nah Bruh'])
plt.show(g)
更多参数请引用:matplotlib.pyplot.legend
关于python - 如何为图形级函数编辑 seaborn 图例标题和标签,我们在Stack Overflow上找到一个类似的问题: https://stackoverflow.com/questions/45201514/