使用 matlab 的 FILL 函数创建一个由直边多边形限定的填充区域:
不幸的是,这在上图中留下了一个小的白色区域,因为我想要填充的区域的边界不是直边多边形,而是在左侧有一个弯曲的边界。我有一条曲线(几乎是抛物线,但不完全是),我想填充两条水平线和曲线本身之间的区域。我还研究了 MATLAB 函数 IMFILL,但没有成功。
最佳答案
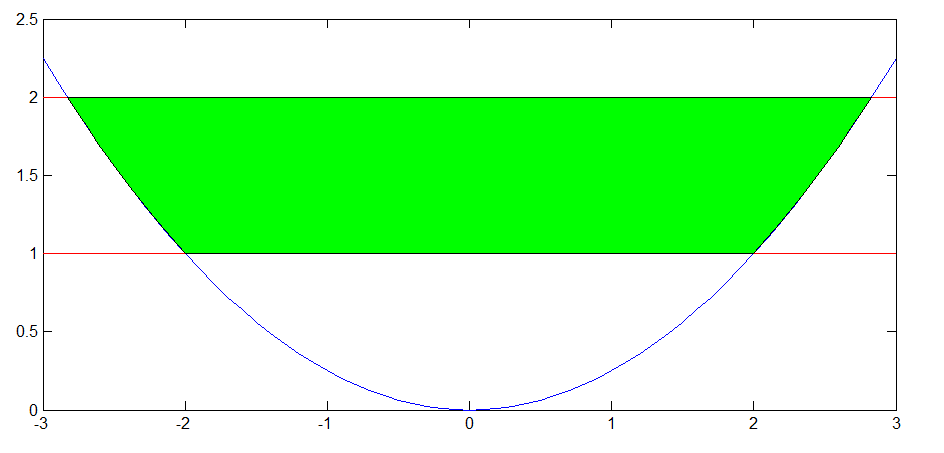
你需要做的是制作一个有更多角的多边形,这样它就能更平滑地贴合曲线:
%# create a parabola and two straight lines
x = -3:0.1:3;
y = x.^2/4;
plot(x,y)
hold on, plot([-3 3],[1 1],'r',[-3 3],[2 2],'r')

%# create a polygon that hugs the parabola
%# note that we need to interpolate separately
%# for positive and negative x
x1 = interp1(y(x<0),x(x<0),1:0.1:2);
%# interpolate in reverse so that the corners are properly ordered
x2 = interp1(y(x>0),x(x>0),2:-0.1:1);

%# fill the area bounded by the three lines
fill([x1,x2],[1:0.1:2,2:-0.1:1],'g')
关于matlab - 如何在 MATLAB 中填充两条直线和一条不直的曲线之间的区域(该区域不是多边形),我们在Stack Overflow上找到一个类似的问题: https://stackoverflow.com/questions/12167974/