我有一个使用 GViz 创建的图表,如下所示:
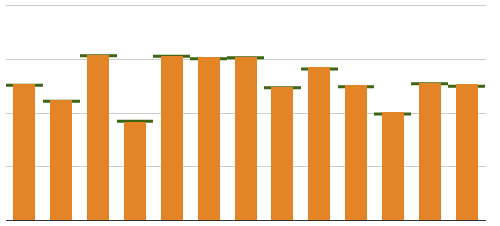
这是一个组合图表,其中一个系列显示为柱形,另一个系列显示为阶梯区域(0% 不透明度,connectSteps : false)。我不想使用线条,因为它只会在每列中间做一个点。
我试图让线条显示在列上方,因为它们代表目标金额。我尝试过切换数据列的顺序,但显示方式相同。有没有办法在系列上指定 z-index?
旁注:这是 Google 网站上的图表,但通过编辑 HTML,我可以指定通过 GViz 可用的大多数选项。我已经浏览了文档,但还没有看到可以执行此操作的内容。
最佳答案
目前无法调整组合图表上的 Z 轴(因此您无法按照目前的方式执行您想要执行的操作)。
但是,如果您想玩点技巧,可以使用 XY 散点图重新创建相同类型的图表。
示例(复制粘贴到 Google Playground):
<!--
You are free to copy and use this sample in accordance with the terms of the
Apache license (http://www.apache.org/licenses/LICENSE-2.0.html)
-->

<!DOCTYPE html PUBLIC "-//W3C//DTD XHTML 1.0 Strict//EN" "http://www.w3.org/TR/xhtml1/DTD/xhtml1-strict.dtd">
<html xmlns="http://www.w3.org/1999/xhtml">
  <head>
    <meta http-equiv="content-type" content="text/html; charset=utf-8"/>
    <title>
      Google Visualization API Sample
    </title>
    <script type="text/javascript" src="http://www.google.com/jsapi"></script>
    <script type="text/javascript">
      google.load('visualization', '1', {packages: ['corechart']});
    </script>
    <script type="text/javascript">
      function drawVisualization() {
        // Create and populate the data table.
        var data = new google.visualization.DataTable();
        data.addColumn('number', 'X');
        data.addColumn('number', 'Sales');
        data.addColumn('number', 'Targets');
        data.addRows([
          [1, 0, null],
          [1, 1, null],
          [1, null, null],
          [2, 0, null],
          [2, 3, null],
          [2, null, null],
          [3, 0, null],
          [3, 3, null],
          [3, null, null],
          [0.5,null,1.5],
          [1.5,null,1.5],
          [1.5,null,null],
          [1.5,null,2.5],
          [2.5,null,2.5],
          [2.5,null,null],
          [2.5,null,3],
          [3.5,null,3],
        ]);

        // Create and draw the visualization.
        var chart = new google.visualization.ScatterChart(
        document.getElementById('visualization'));
        chart.draw(data, {
          width: 600,
          height: 400,
          series: {0:{color: 'black', lineWidth: 40, pointSize: 0}, 1:{color: 'red', lineWidth: 10, pointSize: 0}}  });
      }

      google.setOnLoadCallback(drawVisualization);
    </script>
  </head>
  <body style="font-family: Arial;border: 0 none;">
    <div id="visualization" style="width: 600px; height: 400px;"></div>
  </body>
</html>
关于google-visualization - 在 GViz 中显示列上方的阶梯区域线,我们在Stack Overflow上找到一个类似的问题: https://stackoverflow.com/questions/13918183/