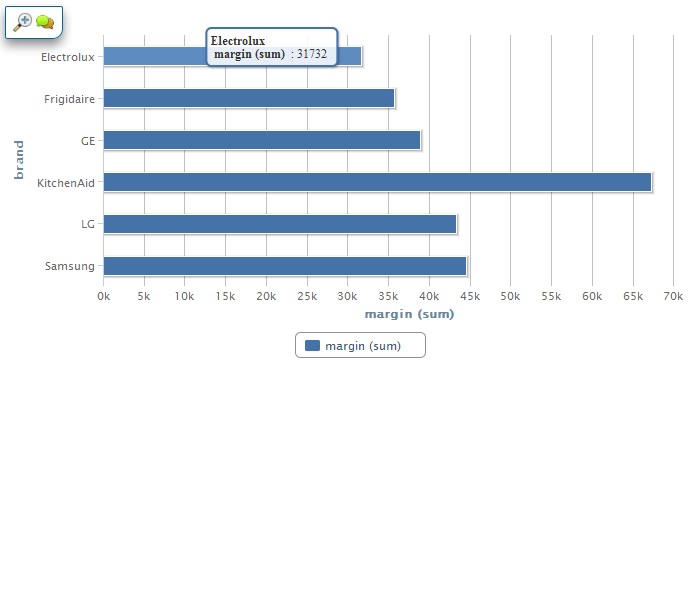
我需要验证条形图中边距(总和)元素的值,如下所示。那么,如何从条形图中伊莱克斯供应商(条形 1)的边际(总和)工具提示中提取值 31732?
下面还给出了包含该值的 div 的 html。
如果您能帮助我指明正确的方向,我将不胜感激。
提前致谢。
<div id="highcharts-60" class="highcharts-container" style="position: relative; overflow: hidden; width: 727px; height: 378px; text-align: left; font-family: "Lucida Grande","Lucida Sans Unicode",Verdana,Arial,Helvetica,sans-serif; font-size: 12px; left: 0px; top: -0.600006px;">
<svg xmlns="http://www.w3.org/2000/svg" version="1.1" width="727" height="378">
<defs>
<rect rx="5" ry="5" fill="#FFFFFF" x="0" y="0" width="727" height="378" stroke-width="0" stroke="#4572A7">
<text class="highcharts-title" x="364" y="25" style="font-family:"Lucida Grande", "Lucida Sans Unicode", Verdana, Arial, Helvetica, sans-serif;font-size:10px;color:#3E576F;fill:#3E576F;" text-anchor="middle" zIndex="1">
<g class="highcharts-grid" zIndex="1">
<g class="highcharts-grid" zIndex="1">
<path d="M 106.5 40 L 106.5 291" fill="none" stroke="#C0C0C0" stroke-width="1">
<path d="M 147.5 40 L 147.5 291" fill="none" stroke="#C0C0C0" stroke-width="1">
<path d="M 187.5 40 L 187.5 291" fill="none" stroke="#C0C0C0" stroke-width="1">
<path d="M 228.5 40 L 228.5 291" fill="none" stroke="#C0C0C0" stroke-width="1">
<path d="M 269.5 40 L 269.5 291" fill="none" stroke="#C0C0C0" stroke-width="1">
<path d="M 310.5 40 L 310.5 291" fill="none" stroke="#C0C0C0" stroke-width="1">
<path d="M 350.5 40 L 350.5 291" fill="none" stroke="#C0C0C0" stroke-width="1">
<path d="M 391.5 40 L 391.5 291" fill="none" stroke="#C0C0C0" stroke-width="1">
<path d="M 432.5 40 L 432.5 291" fill="none" stroke="#C0C0C0" stroke-width="1">
<path d="M 473.5 40 L 473.5 291" fill="none" stroke="#C0C0C0" stroke-width="1">
<path d="M 513.5 40 L 513.5 291" fill="none" stroke="#C0C0C0" stroke-width="1">
<path d="M 554.5 40 L 554.5 291" fill="none" stroke="#C0C0C0" stroke-width="1">
<path d="M 595.5 40 L 595.5 291" fill="none" stroke="#C0C0C0" stroke-width="1">
<path d="M 636.5 40 L 636.5 291" fill="none" stroke="#C0C0C0" stroke-width="1">
<path d="M 676.5 40 L 676.5 291" fill="none" stroke="#C0C0C0" stroke-width="1">
<path d="M 717.5 40 L 717.5 291" fill="none" stroke="#C0C0C0" stroke-width="1">
</g>
<g class="highcharts-series-group" zIndex="3">
<g class="highcharts-series" width="611" height="251" transform="translate(717,291) rotate(90) scale(-1,1)" clip-path="url(https://staging.datarpm.com/analytics/4fbf89e5e4b0a97336652433#highcharts-61)" visibility="visible">
<rect rx="0" ry="0" fill="none" x="220.5" y="352.5" width="18" height="258" stroke-width="5" stroke="rgb(0, 0, 0)" r="0" isShadow="true" stroke-opacity="0.05" transform="translate(-1,-1)">
<rect rx="0" ry="0" fill="none" x="220.5" y="352.5" width="18" height="258" stroke-width="3" stroke="rgb(0, 0, 0)" r="0" isShadow="true" stroke-opacity="0.1" transform="translate(-1,-1)">
<rect rx="0" ry="0" fill="none" x="220.5" y="352.5" width="18" height="258" stroke-width="1" stroke="rgb(0, 0, 0)" r="0" isShadow="true" stroke-opacity="0.15000000000000002" transform="translate(-1,-1)">
<rect rx="0" ry="0" fill="#4572A7" x="220.5" y="352.5" width="18" height="258" stroke-width="1" stroke="#FFFFFF" r="0" fill-opacity="1">
<rect rx="0" ry="0" fill="none" x="178.5" y="319.5" width="18" height="291" stroke-width="5" stroke="rgb(0, 0, 0)" r="0" isShadow="true" stroke-opacity="0.05" transform="translate(-1,-1)">
<rect rx="0" ry="0" fill="none" x="178.5" y="319.5" width="18" height="291" stroke-width="3" stroke="rgb(0, 0, 0)" r="0" isShadow="true" stroke-opacity="0.1" transform="translate(-1,-1)">
<rect rx="0" ry="0" fill="none" x="178.5" y="319.5" width="18" height="291" stroke-width="1" stroke="rgb(0, 0, 0)" r="0" isShadow="true" stroke-opacity="0.15000000000000002" transform="translate(-1,-1)">
<rect rx="0" ry="0" fill="#4572A7" x="178.5" y="319.5" width="18" height="291" stroke-width="1" stroke="#FFFFFF" r="0" fill-opacity="1">
<rect rx="0" ry="0" fill="none" x="136.5" y="293.5" width="18" height="317" stroke-width="5" stroke="rgb(0, 0, 0)" r="0" isShadow="true" stroke-opacity="0.05" transform="translate(-1,-1)">
<rect rx="0" ry="0" fill="none" x="136.5" y="293.5" width="18" height="317" stroke-width="3" stroke="rgb(0, 0, 0)" r="0" isShadow="true" stroke-opacity="0.1" transform="translate(-1,-1)">
<rect rx="0" ry="0" fill="none" x="136.5" y="293.5" width="18" height="317" stroke-width="1" stroke="rgb(0, 0, 0)" r="0" isShadow="true" stroke-opacity="0.15000000000000002" transform="translate(-1,-1)">
<rect rx="0" ry="0" fill="#4572A7" x="136.5" y="293.5" width="18" height="317" stroke-width="1" stroke="#FFFFFF" r="0" fill-opacity="1">
<rect rx="0" ry="0" fill="none" x="94.5" y="62.5" width="18" height="548" stroke-width="5" stroke="rgb(0, 0, 0)" r="0" isShadow="true" stroke-opacity="0.05" transform="translate(-1,-1)">
<rect rx="0" ry="0" fill="none" x="94.5" y="62.5" width="18" height="548" stroke-width="3" stroke="rgb(0, 0, 0)" r="0" isShadow="true" stroke-opacity="0.1" transform="translate(-1,-1)">
<rect rx="0" ry="0" fill="none" x="94.5" y="62.5" width="18" height="548" stroke-width="1" stroke="rgb(0, 0, 0)" r="0" isShadow="true" stroke-opacity="0.15000000000000002" transform="translate(-1,-1)">
<rect rx="0" ry="0" fill="#4572A7" x="94.5" y="62.5" width="18" height="548" stroke-width="1" stroke="#FFFFFF" r="0">
<rect rx="0" ry="0" fill="none" x="52.5" y="257.5" width="18" height="353" stroke-width="5" stroke="rgb(0, 0, 0)" r="0" isShadow="true" stroke-opacity="0.05" transform="translate(-1,-1)">
<rect rx="0" ry="0" fill="none" x="52.5" y="257.5" width="18" height="353" stroke-width="3" stroke="rgb(0, 0, 0)" r="0" isShadow="true" stroke-opacity="0.1" transform="translate(-1,-1)">
<rect rx="0" ry="0" fill="none" x="52.5" y="257.5" width="18" height="353" stroke-width="1" stroke="rgb(0, 0, 0)" r="0" isShadow="true" stroke-opacity="0.15000000000000002" transform="translate(-1,-1)">
<rect rx="0" ry="0" fill="#4572A7" x="52.5" y="257.5" width="18" height="353" stroke-width="1" stroke="#FFFFFF" r="0">
<rect rx="0" ry="0" fill="none" x="10.5" y="247.5" width="18" height="363" stroke-width="5" stroke="rgb(0, 0, 0)" r="0" isShadow="true" stroke-opacity="0.05" transform="translate(-1,-1)">
<rect rx="0" ry="0" fill="none" x="10.5" y="247.5" width="18" height="363" stroke-width="3" stroke="rgb(0, 0, 0)" r="0" isShadow="true" stroke-opacity="0.1" transform="translate(-1,-1)">
<rect rx="0" ry="0" fill="none" x="10.5" y="247.5" width="18" height="363" stroke-width="1" stroke="rgb(0, 0, 0)" r="0" isShadow="true" stroke-opacity="0.15000000000000002" transform="translate(-1,-1)">
<rect rx="0" ry="0" fill="#4572A7" x="10.5" y="247.5" width="18" height="363" stroke-width="1" stroke="#FFFFFF" r="0">
</g>
</g>
<g class="highcharts-legend" zIndex="7" transform="translate(298,337)">
<rect rx="5" ry="5" fill="none" x="0.5" y="0.5" width="130" height="25" stroke-width="1" stroke="#909090" visibility="visible">
<text x="30" y="18" style="font-family:"Lucida Grande", "Lucida Sans Unicode", Verdana, Arial, Helvetica, sans-serif;font-size:12px;cursor:pointer;color:#3E576F;fill:#3E576F;" zIndex="2">
<tspan x="30"> margin (sum)</tspan>
</text>
<rect rx="2" ry="2" fill="#4572A7" x="9.5" y="7.5" width="16" height="12" stroke-width="1" zIndex="3" stroke="#FFFFFF" r="0">
</g>
<g class="highcharts-axis" zIndex="7">
<text x="26" y="165.5" style="font-family:"Lucida Grande", "Lucida Sans Unicode", Verdana, Arial, Helvetica, sans-serif;font-size:12px;color:#6D869F;font-weight:bold;fill:#6D869F;" zIndex="7" transform="rotate(270 26 165)" text-anchor="middle">
<g class="highcharts-axis" zIndex="7">
<text x="411.5" y="323" style="font-family:"Lucida Grande", "Lucida Sans Unicode", Verdana, Arial, Helvetica, sans-serif;font-size:12px;color:#6D869F;font-weight:bold;fill:#6D869F;" zIndex="7" text-anchor="middle">
<tspan x="411.5"> margin (sum)</tspan>
</text>
<path d="M 106.5 40 L 106.5 291" fill="none" stroke="#C0D0E0" stroke-width="1" zIndex="7">
<g class="highcharts-tooltip" zIndex="8" visibility="hidden" transform="translate(202.5577832333554,26.04093567342961)">
<rect rx="5" ry="5" fill="none" x="7" y="7" width="131" height="38" stroke-width="5" fill-opacity="0.85" isShadow="true" stroke="rgb(0, 0, 0)" stroke-opacity="0.05" transform="translate(1,1)">
<rect rx="5" ry="5" fill="none" x="7" y="7" width="131" height="38" stroke-width="3" fill-opacity="0.85" isShadow="true" stroke="rgb(0, 0, 0)" stroke-opacity="0.1" transform="translate(1,1)">
<rect rx="5" ry="5" fill="none" x="7" y="7" width="131" height="38" stroke-width="1" fill-opacity="0.85" isShadow="true" stroke="rgb(0, 0, 0)" stroke-opacity="0.15000000000000002" transform="translate(1,1)">
<rect rx="5" ry="5" fill="rgb(255,255,255)" x="7" y="7" width="131" height="38" stroke-width="2" fill-opacity="0.85" stroke="#4572A7">
<text x="12" y="24" style="font-family:"Lucida Grande", "Lucida Sans Unicode", Verdana, Arial, Helvetica, sans-serif;font-size:12px;color:#333333;padding:0;white-space:nowrap;fill:#333333;" zIndex="1">
<tspan style="text-decoration: underline; font-weight: bold;" x="12">Electrolux</tspan>
<tspan style="font-weight:bold" dy="13" x="12"> margin (sum)</tspan>
<tspan dx="3"> : 31732</tspan>
</text>
</g>
<g class="highcharts-tracker" zIndex="9" transform="translate(717,291) rotate(90) scale(-1,1)" width="611" height="251">
<rect rx="3" ry="3" fill="url(https://staging.datarpm.com/analytics/4fbf89e5e4b0a97336652433#highcharts-62)" x="0.5" y="0.5" width="23" height="19" stroke-width="1" transform="translate(693,348)" zIndex="19" stroke="#B0B0B0">
<rect rx="3" ry="3" fill="url(https://staging.datarpm.com/analytics/4fbf89e5e4b0a97336652433#highcharts-63)" x="0.5" y="0.5" width="23" height="19" stroke-width="1" transform="translate(693,328)" zIndex="19" stroke="#B0B0B0">
<path d="M 6 17 L 18 17 18 14 6 14 Z M 12 14 L 9 9 11 9 11 5 13 5 13 9 15 9 Z" fill="#A8BF77" transform="translate(693,348)" stroke="#A0A0A0" stroke-width="1" zIndex="20">
<path d="M 6 14 L 18 14 18 9 6 9 Z M 9 9 L 9 5 15 5 15 9 Z M 9 14 L 7.5 17 16.5 17 15 14 Z" fill="#B5C9DF" transform="translate(693,328)" stroke="#A0A0A0" stroke-width="1" zIndex="20">
<rect rx="0" ry="0" fill="rgb(255,255,255)" x="693" y="348" width="24" height="20" stroke-width="0" fill-opacity="0.001" title="Export to raster or vector image" zIndex="21" style="cursor:pointer;">
<rect rx="0" ry="0" fill="rgb(255,255,255)" x="693" y="328" width="24" height="20" stroke-width="0" fill-opacity="0.001" title="Print the chart" zIndex="21" style="cursor:pointer;">
</svg>
</div>
最佳答案
我认为,这并不是测试 highcharts 本身,而只是将正确的数据传递给它。因为测试数据是否正确可视化将是 highcharts 的责任。
如果在 JavaScript 中图表已分配给变量(例如 var Chart = new Highcharts.Chart({ ... })),那么您可以尝试通过调用 highcharts series data api 来获取数据
int[] data = js.executeScript("return chart.series.data;");
如果这不起作用,那么您可以随时从 html 中提取数据,如下所示:
//get the element that contains the data
WebElement currentValueElement = driver.findElement(By.xpath('//*[@class="highcharts-tooltip"]//text/tspan[last()]'));

//get the value from that element
int currentvalue = Integer.parseInt(currentValueElement.split(":")[1].trim())
关于Selenium Webdriver - 验证条形图部分(条形)的工具提示中的值,我们在Stack Overflow上找到一个类似的问题: https://stackoverflow.com/questions/14199479/