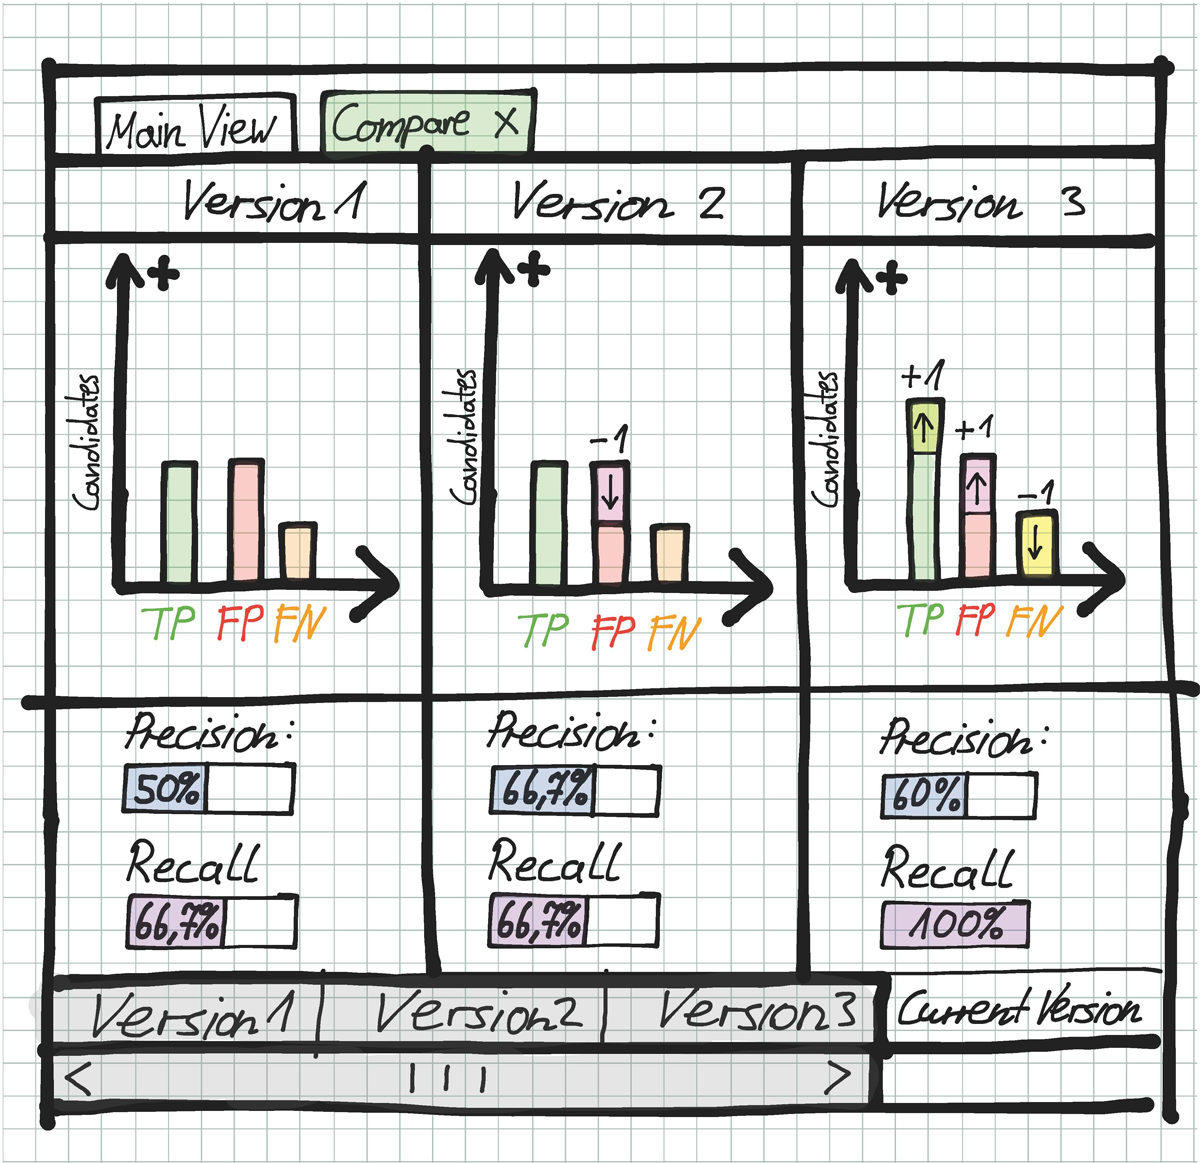
我正在开发一个软件,用于比较不同数量的数据,我想使用图表以水平方式显示它们。 对我来说重要的是一侧仅显示 3 个图表。如果超过 3 个,用户应滚动到其他图表。
最佳答案
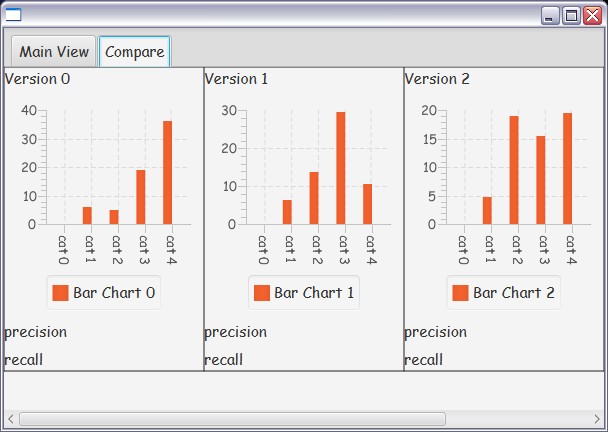
它看起来不会完全像那张图片,我太懒了 CSS。这个想法是将所有图表放在 ScrollPane 内的 GridPane 中。绑定(bind)图表,使宽度恰好为 TabPane 宽度的 1/3。
我使用了 FXML,因为它更容易制作场景。
FXMLDocument.fxml
<?xml version="1.0" encoding="UTF-8"?>

<?import java.lang.*?>
<?import java.util.*?>
<?import javafx.scene.*?>
<?import javafx.scene.control.*?>
<?import javafx.scene.layout.*?>

<TabPane fx:id="tabPane" maxHeight="-Infinity" maxWidth="-Infinity" minHeight="-Infinity" minWidth="-Infinity" prefHeight="400.0" prefWidth="600.0" tabClosingPolicy="UNAVAILABLE" xmlns:fx="http://javafx.com/fxml/1" xmlns="http://javafx.com/javafx/8" fx:controller="horizcharts.FXMLDocumentController">
  <tabs>
    <Tab text="Main View">
      <content>
        <AnchorPane minHeight="0.0" minWidth="0.0" prefHeight="180.0" prefWidth="200.0">
               <children>
                  <Button layoutX="181.0" layoutY="112.0" mnemonicParsing="false" onAction="#addChart" text="Add Chart" />
               </children></AnchorPane>
      </content>
    </Tab>
    <Tab text="Compare">
         <content>
            <ScrollPane maxWidth="1.7976931348623157E308">
               <content>
                  <GridPane fx:id="grid" gridLinesVisible="true">
                  </GridPane>
               </content>
            </ScrollPane>
         </content>
    </Tab>
  </tabs>
</TabPane>
FXMLDocumentController.java
package horizcharts;

import java.net.URL;
import java.util.ResourceBundle;
import javafx.event.ActionEvent;
import javafx.fxml.FXML;
import javafx.fxml.Initializable;
import javafx.scene.chart.BarChart;
import javafx.scene.chart.CategoryAxis;
import javafx.scene.chart.NumberAxis;
import javafx.scene.control.Label;
import javafx.scene.control.TabPane;
import javafx.scene.layout.GridPane;
import javafx.scene.layout.VBox;


public class FXMLDocumentController implements Initializable {

    @FXML GridPane grid;
    @FXML TabPane tabPane;
    private int numCharts = 0;

    @FXML private void addChart(ActionEvent event) {
        VBox vb = randChart(numCharts);
        GridPane.setConstraints(vb, numCharts++,0);
        grid.getChildren().add(vb);
    }

    private VBox randChart(int num){
        CategoryAxis xAxis = new CategoryAxis();
        NumberAxis yAxis = new NumberAxis();
        BarChart<String, Number> bc = new BarChart(xAxis, yAxis);
        BarChart.Series<String, Number> series = new BarChart.Series<>();
        series.setName("Bar Chart "+num);
        bc.getData().add(series);
        for (int i = 0; i<5; i++){
            series.getData().add(new BarChart.Data("cat "+i, Math.random()*10*i));
        }
        bc.prefWidthProperty().bind(tabPane.widthProperty().subtract(6).divide(3));
        bc.prefHeightProperty().bind(tabPane.heightProperty().subtract(180));//guess heights
        VBox vb = new VBox(5,new Label("Version "+num), bc, new Label("precision"), new Label("recall"));
        return vb;
    }

    @Override
    public void initialize(URL url, ResourceBundle rb) {
    }

}
常规主类HorizCharts.java。
package horizcharts;

import javafx.application.Application;
import javafx.fxml.FXMLLoader;
import javafx.scene.Parent;
import javafx.scene.Scene;
import javafx.stage.Stage;

public class HorizCharts extends Application {

    @Override
    public void start(Stage stage) throws Exception {
        Parent root = FXMLLoader.load(getClass().getResource("FXMLDocument.fxml"));
        Scene scene = new Scene(root);
        stage.setScene(scene);
        stage.show();
    }

    public static void main(String[] args) { launch(args); }
}
关于charts - JavaFX 图表水平列表,我们在Stack Overflow上找到一个类似的问题: https://stackoverflow.com/questions/27342905/