我在显示 ASP.NET-MVC-5 应用程序中的条形图时遇到问题。我亲眼目睹 JSON 正确输出(下面应用了示例),并且根据文档我已经包含了所有内容,但输出如下:
HTML:
<div class="jumbotron">
    <h1>Another Chart</h1>
    <canvas id="barChartLoc" width="600" height="400"></canvas>
</div>
这是调用 Controller 的脚本,它返回一个 JSON:
<script type="text/javascript">
function chartFYRevenue() {
        $.ajax({
            url: '@Url.Action("GetLast5FYRevenueAnalysis", "Utility")',
            cache: true
        })
        .done(function (data) {
            var mybarChartLoc = new Chart(document.getElementById("barChartLoc").getContext("2d")).Bar(data);
        })
        .fail(function () {
            alert("Ajax failed to fetch data");
        });
    }

 $(document).ready(function () {
        //auto load on page load
        chartFYRevenue();
});
</script>
这是返回 JSON 的 Controller 。我已经对此进行了测试,这里的情况也很好:
public JsonResult GetLast5FYRevenueAnalysis()
        {
            Models.Chart.BarChartDBContext chartDB = new Models.Chart.BarChartDBContext();

            return Json(chartDB.Test, JsonRequestBehavior.AllowGet);
        }
这是我动态构建图表数据的 Modeler 类:
public class ChartDataSets
    {
        public string label { get; set; }
        public string fillColor { get; set; }
        public string highlightFill { get; set; }
        public string highlightStroke { get; set; }
        public string strokeColor { get; set; }
        public string data { get; set; }
    }

    public class BarChartModel
    {
        public string labels { get; set; }
        public List<ChartDataSets> datasets { get; set; }
    }

    public class BarChartDBContext : Models.DBHelper.DBHelperClass
    {
        public BarChartModel GetLast5FInancialYearRevenue
        {
            get { return getLast5FinancialYearRevenue(); }
        }

        public BarChartModel Test
        {
            get { return test(); }
        }

        private BarChartModel test()
        {
            List<ChartDataSets> _datasets = new List<ChartDataSets>();
            BarChartModel _barChartModel = null;

            _datasets.Add(new ChartDataSets()
            {
                data = string.Format("[{0}]", "10,5,25,35"),
                fillColor = "rgba(220,220,220,0.5)",
                highlightFill = "rgba(220,220,220,0.75)",
                highlightStroke = "rgba(220,220,220,1)",
                strokeColor = "rgba(220,220,220,0.8)",
                label = "s1"
            });

            _barChartModel = new BarChartModel();
            _barChartModel.labels = string.Format("[{0}]", "c1,c2,c3,c4");
            _barChartModel.datasets = _datasets;

            return _barChartModel;
        }
}
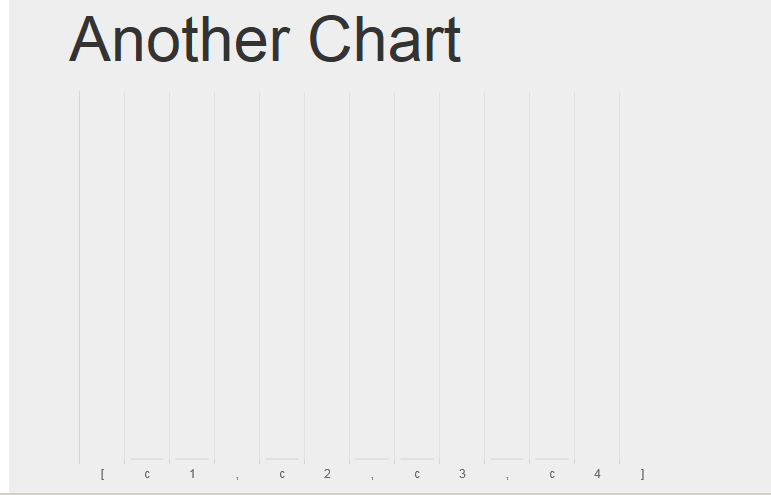
JSON 数据示例:
{
    "labels": "[c1,c2,c3,c4]",
    "datasets": [
        {

            "label": "s1",
            "fillColor": "rgba(220,220,220,0.5)",
            "highlightFill": "rgba(220,220,220,0.75)",
            "highlightStroke": "rgba(220,220,220,1)",
            "strokeColor": "rgba(220,220,220,0.8)",
            "data": "[10,5,25,35]"
        }
    ]
}
更新:
我将 ChartDataSet 和 BarChartModel 类修改为以下内容:
public class ChartDataSets
    {
        public string label { get; set; }
        public string fillColor { get; set; }
        public string highlightFill { get; set; }
        public string highlightStroke { get; set; }
        public string strokeColor { get; set; }
        public string[] data { get; set; }
    }

    public class BarChartModel
    {
        public string[] labels { get; set; }
        public List<ChartDataSets> datasets { get; set; }
    }
最佳答案
您生成的 JSON 数据不正确。正确的输出应该是
"{
    "labels": ["c1","c2","c3","c4"],
    "datasets": [
        {
            "label":"s1",
            "fillColor":"rgba(220,220,220,0.5)",
            "highlightFill":"rgba(220,220,220,0.75)",
            "highlightStroke":"rgba(220,220,220,1)",
            "strokeColor":"rgba(220,220,220,0.8)",
            "data":[10,5,25,35]
        }
    ]
}"
关于ajax - ChartJS 的条形图不渲染,我们在Stack Overflow上找到一个类似的问题: https://stackoverflow.com/questions/31312893/