计算概率密度函数 (PDF) 中某个值的概率密度是很常见的。假设我们有一个均值为 40、标准差为 5 的高斯分布,现在想要获得值为 32 的概率密度。我们会这样:
In [1]: import scipy.stats as stats
In [2]: print stats.norm.pdf(32, loc=40, scale=5)
Out [2]: 0.022
--> 概率密度为 2.2%。
但是现在,让我们考虑逆问题。我有平均值,我有概率密度为 0.05 的值,我想获得标准差(即尺度参数)。
我可以实现的是一种数值方法:创建 stats.norm.pdf 几次,并逐步增加比例参数,并采用该方法,使结果尽可能接近。
在我的例子中,我将值 30 指定为 5% 标记。所以我需要解这个“方程”:
stats.norm.pdf(30, loc=40, scale=X) = 0.05
有一个名为“ppf”的 scipy 函数,它是 PDF 的逆函数,因此它将返回特定概率密度的值,但我还没有找到返回比例参数的函数 em>.
实现迭代会花费太多时间(创建和计算)。我的脚本将会很大,所以我应该节省计算时间。在这种情况下 lambda 函数有帮助吗?我大概知道它是做什么的,但到目前为止我还没有使用过它。对此有什么想法吗?
谢谢!
最佳答案
normal probability density函数,f 由下式给出

给定f和x,我们希望求解𝞼。来问一下sympy如果它能解方程:
import sympy as sy
from sympy.abc import x, y, sigma

expr = (1/(sy.sqrt(2*sy.pi)*sigma) * sy.exp(-x**2/(2*sigma**2))) - y
ans = sy.solve(expr, sigma)[0]
print(ans)
# sqrt(2)*exp(LambertW(-2*pi*x**2*y**2)/2)/(2*sqrt(pi)*y)
所以看来 LambertW function 存在一个封闭式的解决方案。 ,W,满足
z = W(z) * exp(W(z))
对于所有复值z。
我们还可以使用 sympy 来查找给定 x 和 y 的数值结果,但是
也许用以下方法进行数值计算会更快
scipy.special.lambertw :
import numpy as np
import scipy.special as special

def sigma_func(x, y):
    results = set([np.real_if_close(
        np.sqrt(2)*np.exp(special.lambertw(-2*np.pi*x**2*y**2, k=k)/2)
        /(2*np.sqrt(np.pi)*y)).item() for k in (0, -1)])
    results = [s for s in results if np.isreal(s)]
    return results
一般来说,LambertW 函数返回复数值,但我们只是
对 sigma 的实际值(value)解决方案感兴趣。 Per the
docs ,
当k=0 和k=1 时,special.lambertw 有两个部分实数分支。所以
上面的代码检查返回值(对于这两个分支)是否为实数,并且
返回任何实际解决方案的列表(如果存在)。如果不存在真正的解决方案,
然后返回一个空列表。如果 pdf 值 y 不是,就会发生这种情况
对于 sigma 的任何实际值(对于给定的 x 值)所获得的值。
你可以像这样使用它:
x = 30.0
loc = 40.0
y = 0.02
s = sigma_func(loc-x, y)
print(s)
# [16.65817044316178, 6.830458938511113]

import scipy.stats as stats
for si in s:
    assert np.allclose(stats.norm.pdf(x, loc=loc, scale=si), y)
在您给出的示例中,y = 0.025,没有 sigma 的解:
import numpy as np
import scipy.stats as stats
import matplotlib.pyplot as plt

x = 30.0
loc = 40.0
y = 0.025
s = np.linspace(5, 20, 100)
plt.plot(s, stats.norm.pdf(x, loc=loc, scale=s))
plt.hlines(y, 4, 20, color='red')  # the horizontal line y = 0.025
plt.ylabel('pdf')
plt.xlabel('sigma')
plt.show()
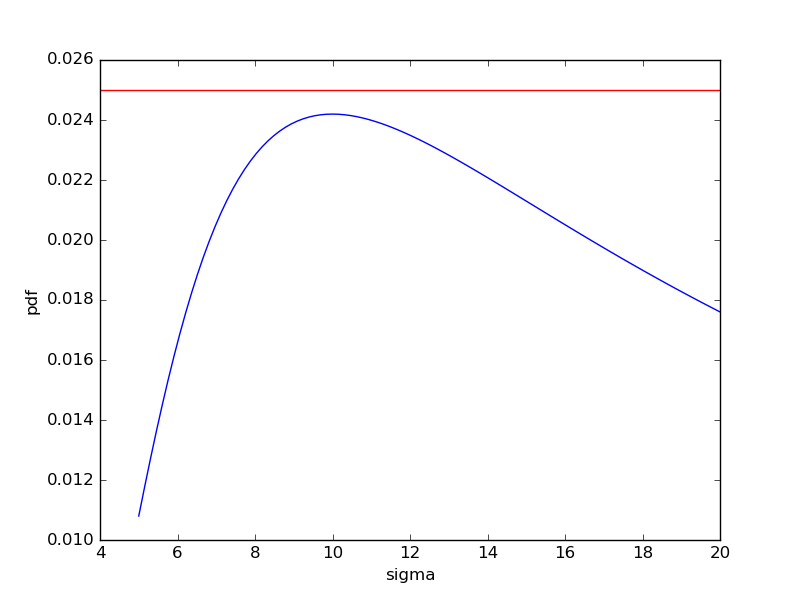
因此 sigma_func(40-30, 0.025) 返回一个空列表:
In [93]: sigma_func(40-30, 0.025)
Out [93]: []
上面的图是典型的,当 y 太大时,为零
解,在曲线的最大值处(我们称之为y_max)有一个
解决方案
In [199]: y_max = np.nextafter(np.sqrt(1/(np.exp(1)*2*np.pi*(10)**2)), -np.inf)

In [200]: y_max
Out[200]: 0.024197072451914336

In [201]: sigma_func(40-30, y_max)
Out[201]: [9.9999999776424]
对于小于 y_max 的 y,有两种解决方案。
关于python-2.7 - Python(Scipy): Finding the scale parameter (standard deviation) of a gaussian distribution,我们在Stack Overflow上找到一个类似的问题: https://stackoverflow.com/questions/36159067/