在为散点图创建趋势线时,我使用 add_trace 添加线性趋势线。
当数据只有一个“系列”数据时,即只有一组坐标,下面的代码可以正常工作。然而,当我介绍一些系列时,“趋势线”是这样的:

这是代码的相关部分:
    p <- plot_ly(filteredFull(), x=Relative.Time.Progress, y=cumul.ans.keystroke,
                 mode='markers', color=KeystrokeRate, size=KeystrokeRate,
                 marker=list(sizeref=100), type='scatter',
                           hoverinfo='text', text=paste("token: ",Token, "Keystrokes: ",
                                                          KeystrokeCount)) %>%
        layout(
          xaxis=list(range=c(0,1)),
          yaxis=list(range=c(0,max(filteredFull()$cumul.ans.keystroke)))
        )

     lm.all <- lm(cumul.ans.keystroke ~ Relative.Time.Progress,
              data=df)
      observe(print(summary(lm.all)))
      p <- add_trace(p, y=fitted(lm.all), x=Relative.Time.Progress,
                     mode='lines') %>%
        layout(
          xaxis= list(range = c(0,1))
        )
p
如果有必要,我可以添加更多代码,或者尝试制作一个最小的工作示例。但是,我希望这是一个熟悉的问题,从代码中可以明显看出。
最佳答案
我认为您需要在 add_trace(p, y=fitted(lm.all), x=Relative.Time.Progress,模式='行')。
第一条轨迹似乎是一个子集,但第二条轨迹使用通过将回归模型拟合到整个数据集而获得的回归拟合值。
filteredFull() 中的 Relative.Time.Progress 与 df 之间可能不匹配。
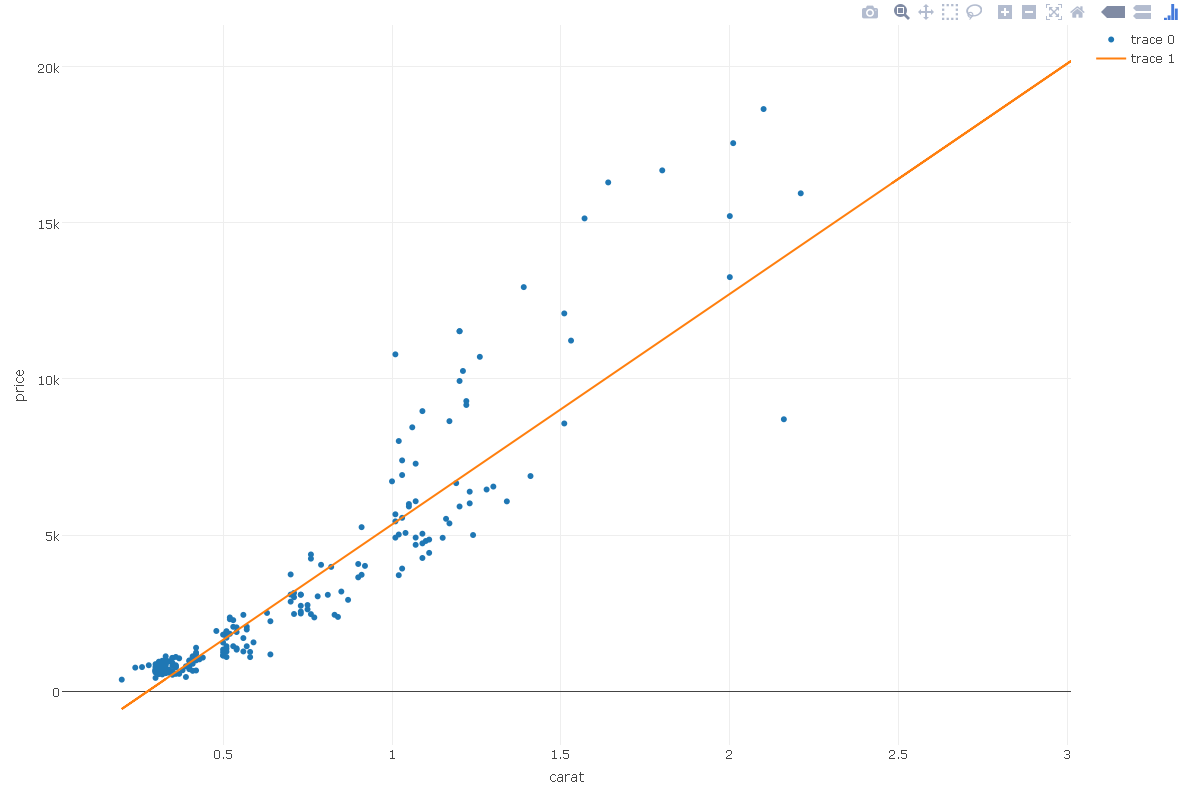
这是一个例子。希望有帮助...
library(plotly)
df <- diamonds[sample(1:nrow(diamonds), size = 500),]

fit <- lm(price ~ carat, data = df)

df1 <- df %>% filter(cut == "Ideal")

plot_ly(df1, x = carat, y = price, mode = "markers") %>%
  add_trace(x = carat, y = fitted(fit), mode = "lines")

plot_ly(df1, x = carat, y = price, mode = "markers") %>%
  add_trace(data = df, x = carat, y = fitted(fit), mode = "lines")
关于r - plotly 上没有创建线性趋势线,我们在Stack Overflow上找到一个类似的问题: https://stackoverflow.com/questions/37218319/