举个例子
library(ggplot2)
library(plotly)
df <- data.frame(V1=gl(6,20), V2=gl(40,3))
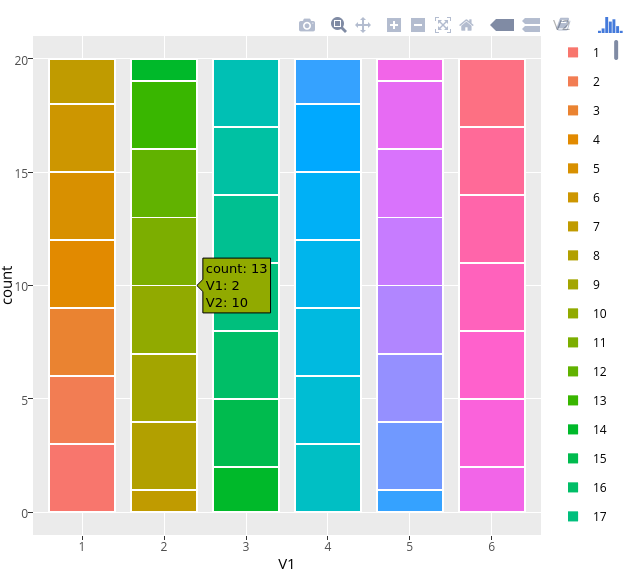
p <- ggplot(df, aes(x=V1, fill=V2)) + geom_bar(color="white")
ggplotly(p)
一些条形图段不显示工具提示/悬停信息,而图例则很好地显示了大量的因子水平(=滚动条)。我怎样才能解决这个问题?
我正在使用
packageVersion("ggplot2")
# [1] ‘2.2.0’
packageVersion("plotly")
# [1] ‘4.5.6’
编辑/仅供引用:Crossposted to GitHub 。
最佳答案
添加一些代码。我们可以修复它:
library(ggplot2)
library(plotly)
df <- data.frame(V1=gl(6,20), V2=gl(40,3))
p <- ggplot(df, aes(x=V1, fill=V2)) + geom_bar(color="white")
fixed<-ggplotly(p)

for (i in 1:length(levels(df$V2))){
  fixed$x$data[[i]]$text[length(fixed$x$data[[i]]$text)+1] <- c("")
}
fixed
关于r - plotly + ggplot2 : Some tooltips missing in stacked barplot,我们在Stack Overflow上找到一个类似的问题: https://stackoverflow.com/questions/41184959/